What is the last time you read an article about the agricultural market? For most investors it will probably be a very long time ago. Any wonder that agriculture could be starting a new bull market at this point?
It is a typical phenomenon that bull markets are born when there is no investment interest, and, accordingly, when there is complete silence in the media about that specific market.
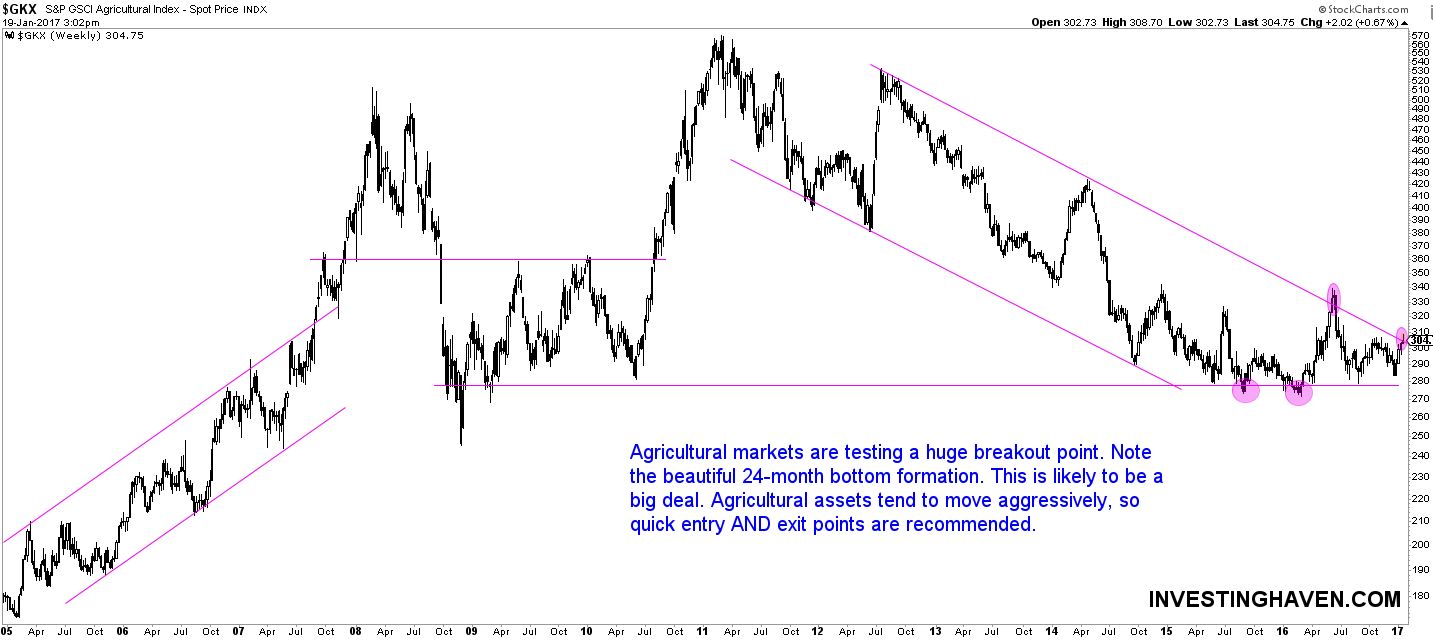
As shown below the S&P GSCI Agricultural Index, representing the agricultural commodities market, has a great setup chart. InvestingHaven’s research team selected the long term chart, spanning over +10 years, to make that point. The chart provides 3 important insights to investors which could suggest a new bull market is about to start:
- The Agricultural Index is testing the long term bear market as evidenced by the test of the falling trendline (purple circle at the right).
- The Agricultural Index went through a 24-month bottom formation which is an exceptionally long time. Such a long bottom mostly suggests it is very solid support.
- The bottoms of 2015 and 2016 coincide with the 2010 and 2011 bottoms.
The Agricultural Index gained 10 percent since it bottomed in 2016. Year-to-date, the index is 3 percent higher.
The different agricultural commodities that are part of the index are Wheat, Corn, Sugar, Soybean, Coffee, Cocoa, Cotton.


