If Economics is the analyses of balancing act between supply and demand, the macro fundamental analysis is considering both social and economic indicators to assess the market direction and what Stocks could outperform in a certain environment or under specific conditions.
This article covers 4 steel and iron stocks that are set to benefit from Trump’s tariffs. These stocks were identified based on the previously mentioned analysis in addition to price analysis.
When the news was released about President Donald Trump’s intention to impose a global tariffs of 25 per cent on steel and 10 per cent on aluminium investors were disappointed, and the stock market took a bearish turn. Things only got worst when the European Union and China both voiced their dissatisfaction and promised to repay in kind if the tariff bill passed. The general reaction was questioning whether President Donald Trump understood what he was doing or not.
So far the mainstream media’s perspective.
At InvestingHaven, we took a step back to analyse this important action from a neutral perspective, and examine the price action from the charts. If we consider the new tariffs objectively, InvestingHaven’s research team believes that President Trump is merely fulfilling his promise to Americans of bringing more businesses back to the America. Hence, the tariffs aim to encourage steel and iron companies in America to work and help one another internally thereby promoting economic growth.
Once these local companies have increasing business they will be able to employ more people, therefore creating jobs, which was another promise made by the president. As long as the economic growth is sustainable it is hard to argue against a bullish stock market outlook in the long run.
The most important sector ETF that covers the Iron and Steel industry is SLX. This ETF gives investors exposure to publicly traded companies primarily involved in steel production, including the operation of manufacturing mills, fabrication of productions, and the extraction and reduction of iron ore. SLX is poised to benefit nicely from increased steel demand as the global economic recovery picks up speed and from continued investments in infrastructure. Although SLX has been covered about 2 months ago, we will update the chart with the latest price action.
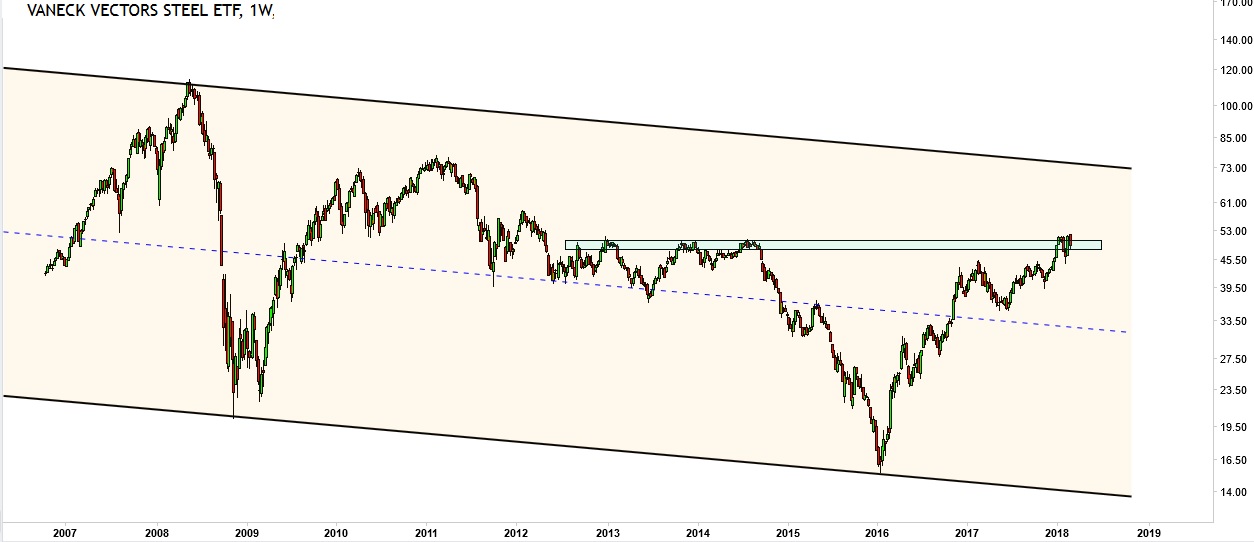
SLX price on the weekly chart is evolving in a diagonal channel. During the top in May 2008, which coincided with the global financial crisis, the price of SLX plunged in an almost vertical move from the top of the channel to the bottom. From then on the recovery was in a seesaw fashion and never really challenged the previous top. The price in fact drifted downwards and made another lower bottom in Jan 2016. It was a V-shape recovery that propelled the price to its major resistance of ~48 – 51. So far, this price is holding up well.
As long as the next immediate support level of 45 is not breached, the bullish case favoring the price breaking the current resistance level is increasingly likely. The next target will definitely be the top of channel again ~73 within next 2-3 years or earlier.
Steel stock #1 – AK Steel Holding Corporation (NYSE: AKS)
AK Steel Holding Corporation is a steelmaking company headquartered in West Chester Township, Butler County, Ohio. The company is a producer of flat-rolled carbon, stainless and electrical steel products, and carbon and stainless tubular products, primarily for automotive, infrastructure and manufacturing, electrical power generation and distribution markets.

Monthly chart of AKS
The monthly chart of AKS shows a potential repeat of history. What does this mean for investors? The highlighted inverted head and shoulders consolidation that took six years to complete (2000 – 2006) resulted in a 2 years ballistic price run to the top of channel collapsed along 2008’s global financial crisis. The price made another bottom in Jan 2016. The second highlighted potential head and shoulder is not completed yet. The price is still consolidating at the right shoulder zone for more time.
Our first target is ~9.8 to be reached by the end 2018 or somewhere in 2019. Should the price break above the median line there is a possibility the price might reach the top of the channel ~60.
Should the price break below 4, then the entire bullish case is invalidated. We do not rule out the price being entangled at this zone for an indefinite amount of time.
Steel stock #2 – United States Steel Corporation (NYSE: X)
United States Steel Corporation, more commonly known as U.S. Steel, is an American integrated steel producer headquartered in Pittsburgh, Pennsylvania, with production operations in the United States, Canada, and Central Europe. U. S. Steel is dedicated to the automotive industry who currently produce a wide variety of hot-rolled, cold-rolled, galvanized and Galvannealed products for car manufacturers
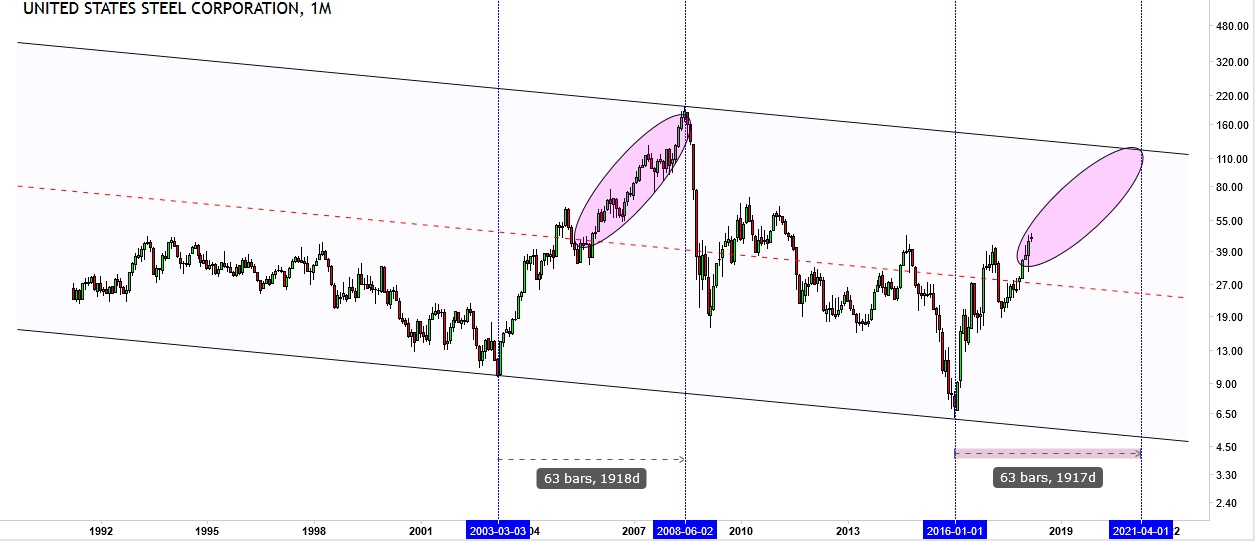
Monthly chart of X
An important observation on the monthly chart of X is that from 2003 onwards the stock price rallied from the bottom of the channel to the top. It happened for about 5 years before reaching a peak at the 2008 global financial crisis. It took the price 10 years to finally reach the bottom of channel again. If history does repeat itself, then the price is estimated to reach the top of the channel by 2021 with the same price movement. For the bullish case, the next target will be ~63.8 by end of 2018. In the short term, there could be a retracement back to 40.3 and even ~35.7.
Steel stock #3 – Friedman Industries Inc (NYSE: FRD)
Friedman Industries Incorporated was founded in March 29, 1965. The company is engaged in steel processing, pipe manufacturing and processing and steel and pipe distribution. The Company has two product groups: coil and tubular products. Friedman Industries’ oscillate coil winding business segment engages in the processing and distribution of hot-rolled steel coils at its locations in Hickman, Arkansas and Decatur, Alabama. The Company’s XSCP division markets excess prime and secondary hot-rolled steel coils. The tubular business segment of Friedman Industries operates under the division, Texas Tubular Products (TTP). TTP is located in Lone Star, Texas and engages in the manufacturing, processing, and distribution of steel pipe.
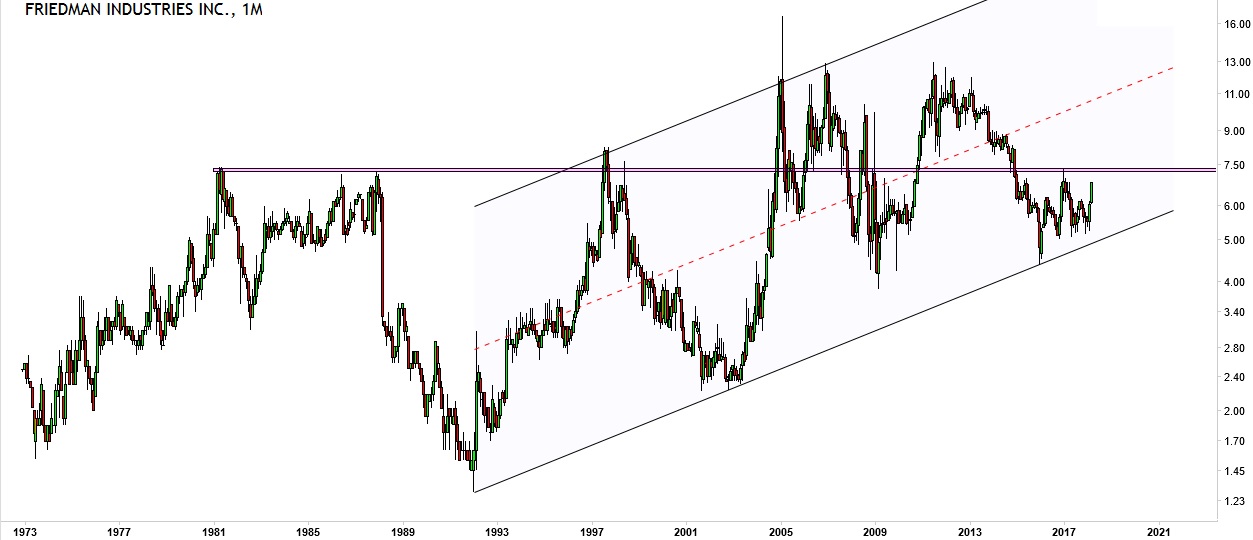
Monthly chart of FRD
The monthly chart of FRD shows that a potential W pattern is forming after the basing started In Jan 2016. The immediate target of 7.3 should be reached within the next 2 to 3 months. Upon reaching this resistance, the price could break instantly to get to 8.2. After hitting 7.3, the price could actually reverse to 6.25 or 5.25 for bearish case.
Steel stock #4 – Nucor Corporation (NYSE: NUE)
Nucor Corporation is a producer of steel and related products headquartered in Charlotte, North Carolina. It is the largest steel producer in the United States of America and the largest steelmaker (i.e. it uses electric arc furnaces to melt scrap steel as opposed to blast furnaces to melt iron). Nucor produces steel bars (carbon and alloy steel), beams, sheet / flat rolled steel, plate, steel joists, joist girders, steel deck, fabricated concrete reinforcing steel, cold finished steel, steel fasteners, metal building systems, light gauge steel framing, steel grating, expanded metal, and wire and wire mesh. In addition, through its David J. Joseph Company subsidiary, Nucor also brokers ferrous and nonferrous metals, pig iron and HRI/DRI; supplies ferro-alloys; and processes ferrous and nonferrous scrap.

Monthly chart of NUE
The historical big picture of NUE has a very unique pattern. After basing with a W in the 70ies its stock price broke resistance after which a very strong 3 year rally followed. It then consolidated into a 11 years rising wedge consolidation. As a general rule of thumb, the rising wedge pattern is traditionally viewed as bearish if the price breaks the lower triangle line. In this case, however, the price did the opposite of breaking out above and quickly engaged into another 8 years of consolidation as bull flag. The longest triangle consolidation to date took 13 years to form since 2005. The price finally broke above and fell into a whipsaw mode.
As long as the price doesn’t break below 59.4, our bullish stance remain and the price is expected to challenge the previous resistance at ~83.2 by year end if not 2019. Should 59.4 fails to hold, the next level is ~51.5
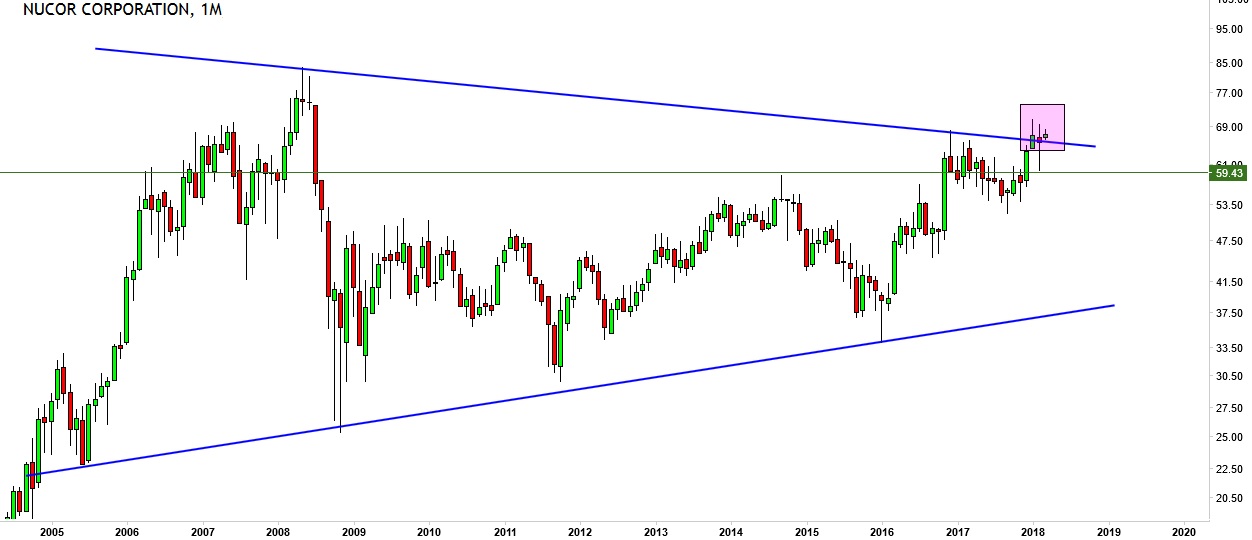
Chart of NUE: smaller timeframe
The media is very quick to use past data to point out how the previous tariff by former President George Bush caused a turmoil in the stock market. Investors are obviously fearful because the chances of history repeating itself are possible. However, the charts of both the steel ETF and stocks mentioned above do not convey any major bearish outlook.
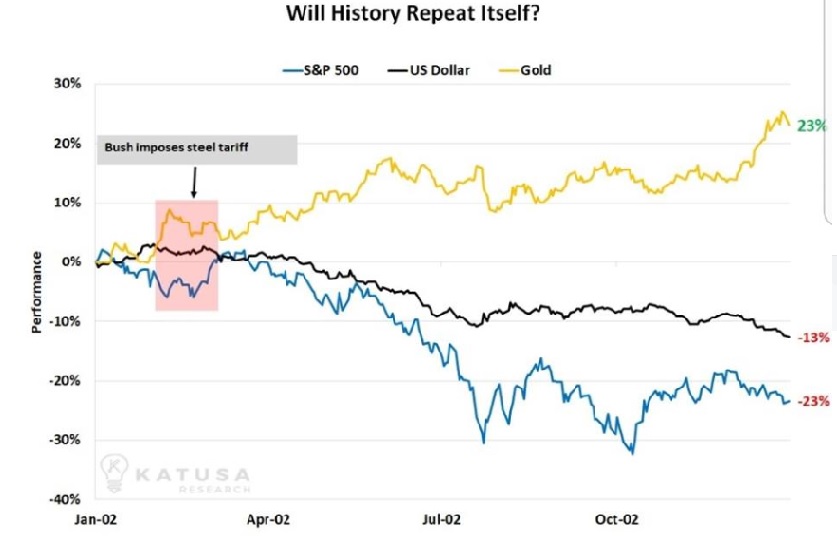
Market performance after former President Bush passed the tariff bill in 2002
Regardless of how bullish InvestingHaven is on Steel Stocks after Trump’s tariff, investing is a risky business and investors should always have clear price levels where the Bullish case can turn Bearish. That is the essence of managing risk and maximizing returns.
Gain an insight into Metal Folding by visiting the website og Vigar Sheetmetal.


