The land of the rising sun – which is often used to refer to Japan – has a pretty famous and notorious side. After the surrender of Imperial Japan in 1945, Japan went through a period of Dark Age, hardship and uncertainty. In a nutshell, it took them hard effort and work, sweat and pain to become the first developed country in Asia.
Nikkei 225 (日経平均株価 Nikkei heikin kabuka, 日経225) was created and began its calculation in 1950. It is a price-weighted index that consists of top 225 blue-chip companies listed on the Tokyo Stock Exchange, operating in the Japanese Yen (JP¥)
We have been looking at tonnes of charts ever since we embarked on Chart Analysis. But you have to agree with the fact that the CANDLESTICK chart is a terrific creation by an unsung Japanese hero which was named Munehisa Homma, a rice trader from the 1960s. Steve Nison is the first student to learn about candlestick. The rest is history. Let’s not deviate too much from the chart.
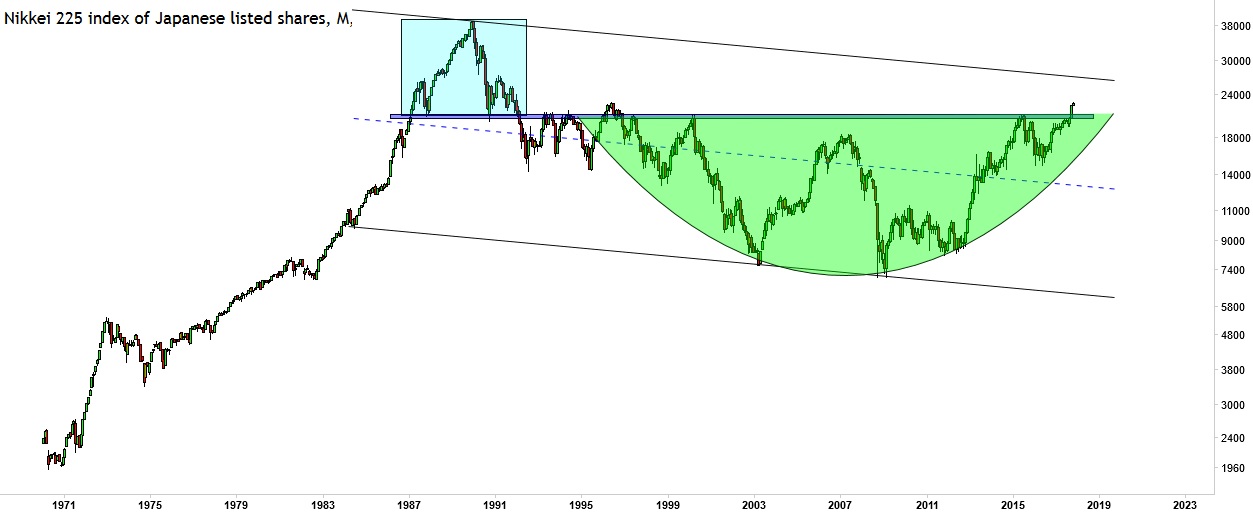
The above historical chart goes back to 1970. As you can see since the December 1989 top the index has been falling hard, experiencing 2 major dump during the 2000 dotcom bubble and 2007 global financial crisis. Since then, Prime Minister of Japan Shinzo Abe has emulated the effort of Fed Reserve on QE, printing excessive amount of Yen to shove up the economy.
The “imaginary” rounding bottom green cup is drawn to engulf a W-liked price movement which price has thus broken to the upside of the neckline resistance of the massive head and shoulder pattern in the late 1980s
It definitely shows that Abenomics has exerted its effect in lifting up the economy and index.
Where do we foresee the index in the next 2-3 years’ time? A conservative projection will be ~26000 which coincide with the channel top resistance, whether or not economy is strong enough by then, we will update in due course.


