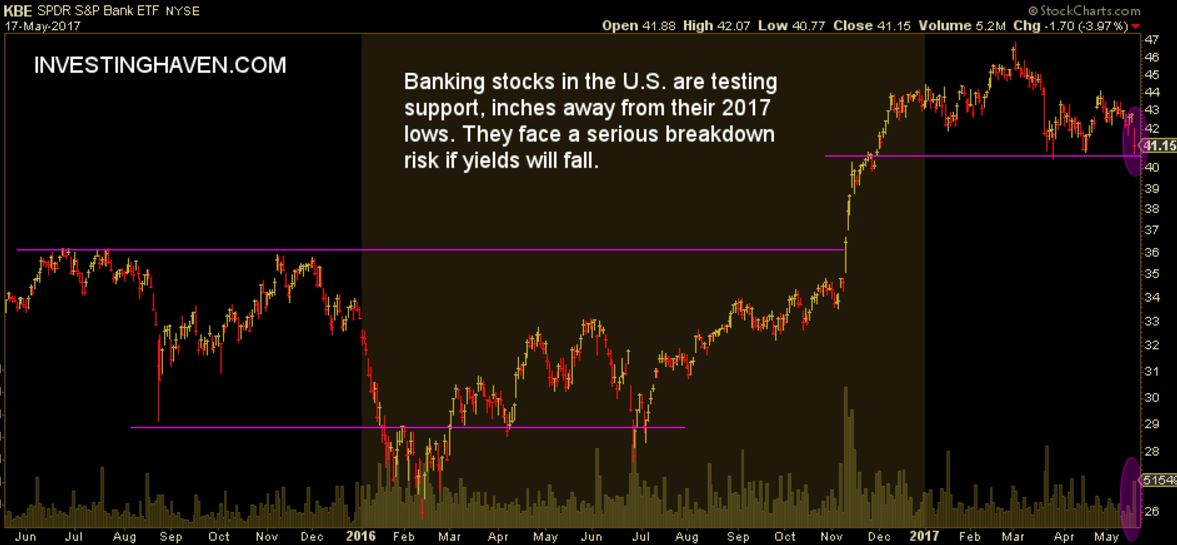
The key in understanding future moves of stock markets is understanding the underlying sector dynamics. Leaders tend to become laggards, and vice versa. So when former leaders start to lag you better pay attention. Case in point: banking stocks in the U.S. are starting to lag behind.
According to the the banking stocks chart (KBE ETF) the banking sector is on the verge of a breakdown. That could really become nasty, not only for the banking sector but, more so, for the stock market as a whole.
The point is that the financials have been the leaders of the Trump rally. As said before, the market rotated into value stocks vs growth stocks. Note that value stocks is a group of stocks that include financials, energy and industrials.
Basically, the so-called ‘Trump effect’ triggered the revival of value stocks, with financials as the clear leader. That was because of intermarket dynamics: rising rates triggered a rally in financial stocks.
If financials are breaking down, on falling interest rate, it will take away the driver of stock markets. That is a recipe for … lower stock prices. And that would be fully in line with our Market Barometer Suggesting Serious Volatility As Of Summer 2017.
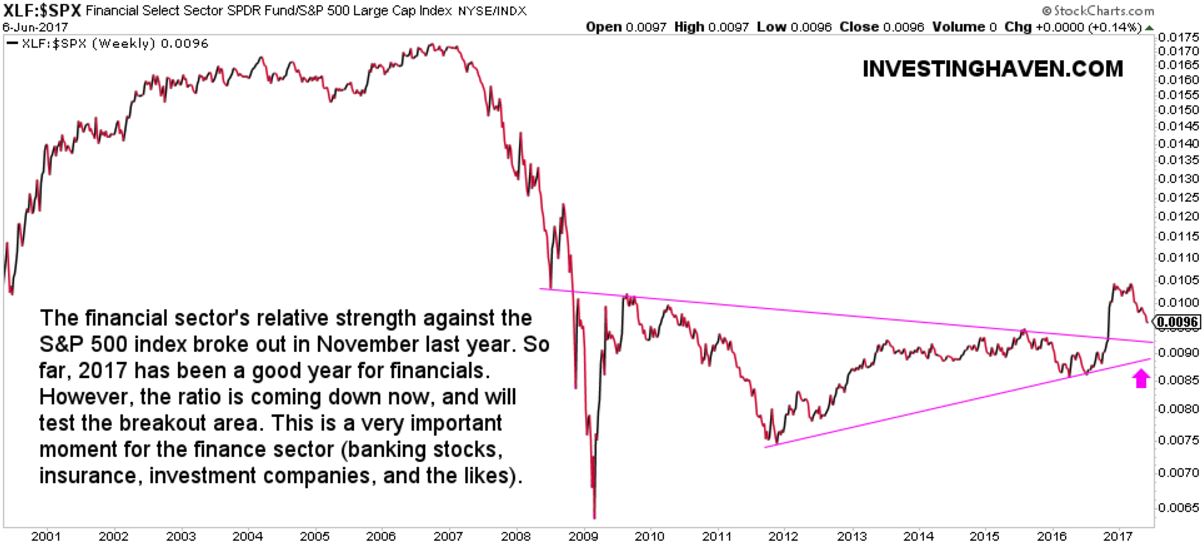
The above chart could look pretty scary, but the one below is even worse. It shows the relative strength of financial stocks vs. the S&P 500. Though the timeframe is much longer than the one above, it is worth zooming out from time to time.
The relative strenght chart confirms the potential breakdown of the financial sector. Note the triangle pattern which is a meaningful one. If the ratio breaks below this triangle it would be very bearish for stock markets at a whole.
Smart investors keep a close eye on the financials sector and its relative strength in the coming weeks and months.


