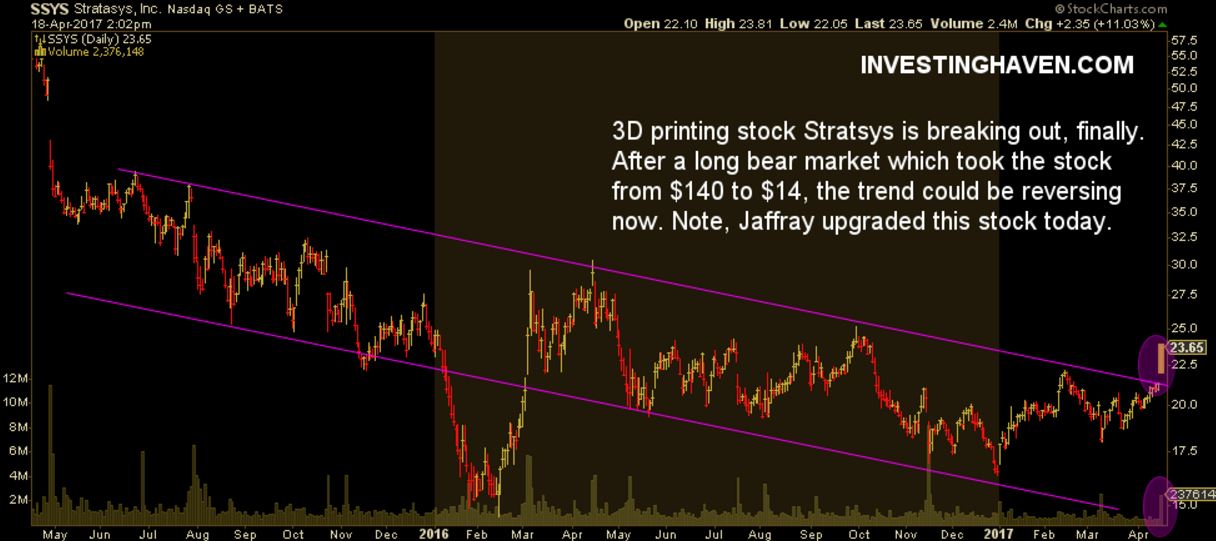
The long awaited breakout in the 3D printing space is there. Today, Stratasys is leading the sector higher, with a rally of more than 10 percent intraday on higher than average trading volume.
Interestingly, investment bank Piper Jaffray upgraded 3D printing stocks Stratasys from neutral to overweight. That is quite drastic. Their first upside target is $28, which, coincidentally, is close to our first target.
Investors.com summarized the research note from Jensen which forecasts that 3D printing stock Stratasys will outperform competitors like 3D Systems (DDD).
Based on a Piper survey of 3D printer resellers, Stratasys experienced “a meaningful uptick in system demand for the second consecutive quarter,” Jensen wrote. He said many resellers say they are entering 2017 with a solid pipeline, “and are upbeat that this year will be a better one for system sales vs. 2016.”
According to Wohlers Report 2017, 3D printer sales grew 17.4% to $6.06 billion in 2016. That’s down from 26% growth in 2015.
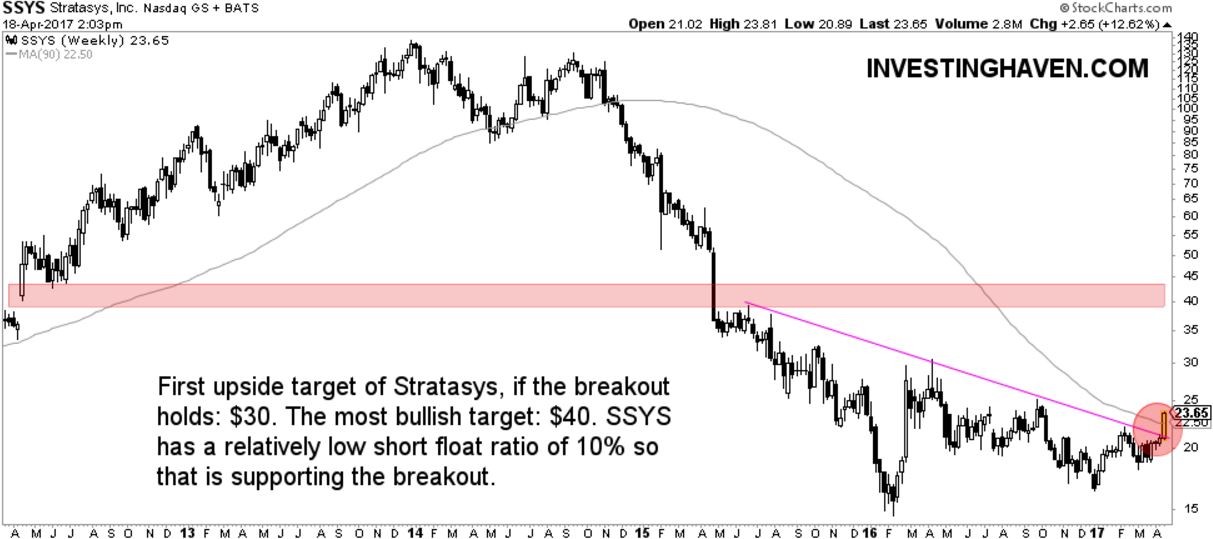
The breakout in Stratasys is visible both on the daily and weekly chart.
First, the daily chart on 2 years shows the falling bear market channel. The stock moved for 22 out of the past 24 months in a clear channel. Though not visible on this chart (the second chart shows that in a clearer way), the bear market in 3D printing resulted in a real collapse in 3D printing stocks. Stratasys fell from $140 to $14 in 16 months time, that is a crash of 90 percent! InvestingHaven has been following this space closely: the less interest by the market, the more interest by our research team. Today is the first sign that our strategy could be paying off.
Today is the first day of the breakout on significantly higher than average volume. The key question is whether the breakout is for real. Investors want to see at least 5 consecutive days above the breakout point which is $22.
The weekly chart, over 5 years, also shows the recent bear market and it combines it with insights in the upside potential. The gap lower in March of 2015 is an important data point from a price analysis point of view (red bar on the chart). That is the most bullish short to medium term upside target. The first upside target, if the breakout holds, is the peak of April of 2016, at $29 to $30, right below Jaffray’s target.


