Copper (COPPER) price started retracing 2 weeks ago after hitting a high of 3.20 USD. We covered the price action in our article Copper Retracing. How Low Can The Price Of Copper Fall? We said back then that we foresee 2 scenarios for copper:
-
Either it remains above $2.80 in which case it confirms its breakout and creates a new trading range (the 3d one in 2 years time)
-
Or it falls back in its previous trading range in which case the most likely path is that it will trade between $2.45 and $2.70.
We favored Scenario # 1 as we believe Copper broke out of its long term bear market. It looks like the price action during the last 2 weeks confirms this forecast. Here is why:
Copper price Broke out of its long term bear market
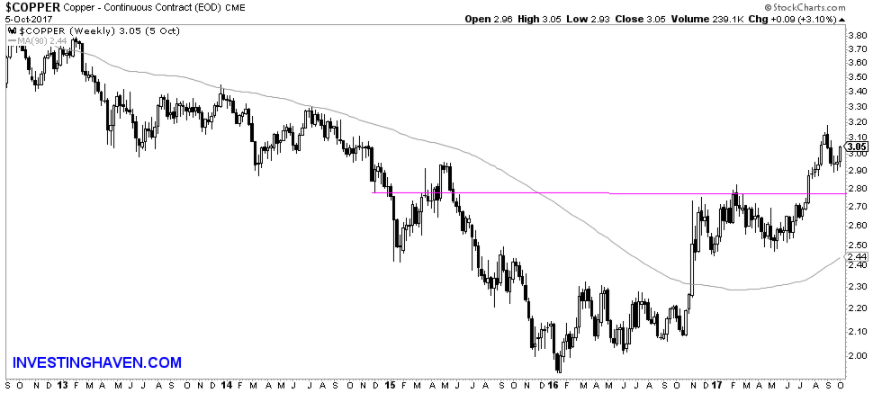
The chart above is Copper’s 5 years weekly chart. It clearly shows how 2.80 USD is the line in the sand. Copper price is Bullish above, back to trading in the 2.45 to 2.70 Range if it crosses below.
This view also illustrate how 2016 was the bottom in Copper price and that November 2016’s Copper price surge was the start of the reversal. Investinghaven covered this important price action in our article Copper price Surging, close to a secular Bull market. We encourage you to read it as the insight from that article from October 2016 is still valid today.
The price action from the last 2 weeks was a successful backtest for Copper price confirming the breakout.
What’s next for Copper price
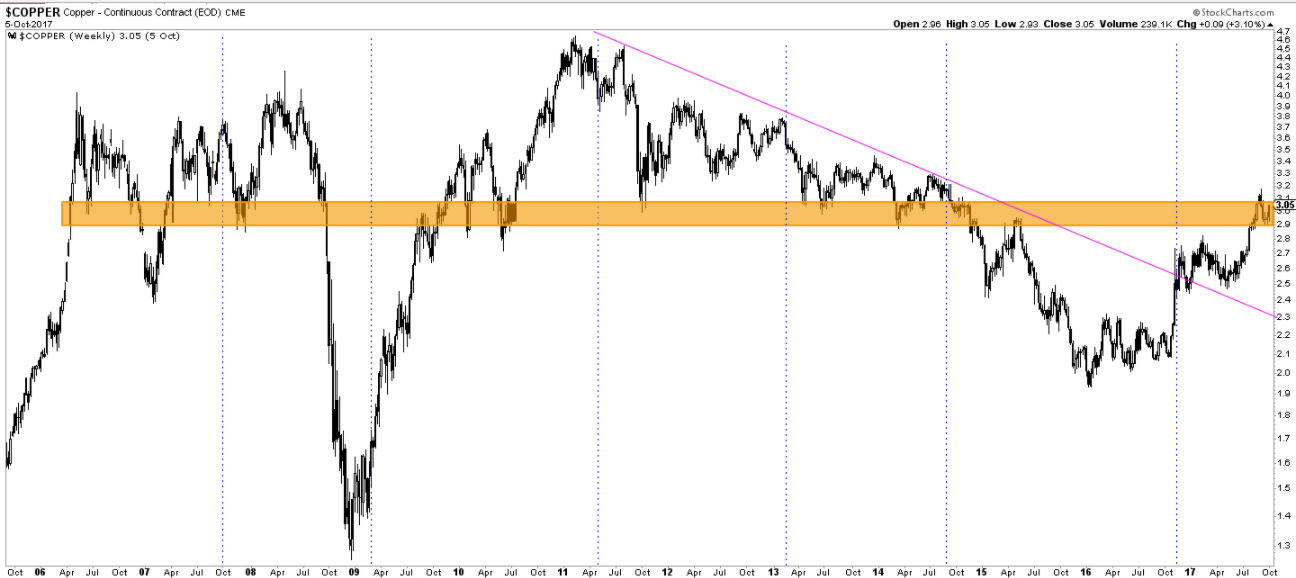
Our next chart covers Copper price for the last 11 years. This view also shows how copper price hit bottom in 2016. We also see how the price is at a resistance area that has served as a strong price support over a significant period of time with the last period being between 2011 to 2014. The orange line marks this resistance area and that’s where Copper price is moving right now.
So the answer to what’s next is 2 possibilities:
- A break above the 2.9 to 3.1 USD resistance area could signal a sharp movement upward for Copper. We can possibly see Copper price moving in a 2.9 to 3.1 USD sideways price action prior.
- A break below 2.8 could lead to the price falling back in the previous 2.45 to 2.70 range. This scenario is less likely.
Overall, Copper looks bullish right now though we want to see 3.20 clear anytime soon. If that does not happen it can be a double top which would be concerning.


