Gold has confused both bulls and bears this year, and that was our main theme this year. If such a pattern continues for a longer period of time, which it did throughout this year, it simply indicates a sideways trend, and that is a consolidation. That sideways trend could continue in 2018, but there is also a risk of a breakdown in gold as 2018 kicks off.
Gold: from a secular bear market to a consolidation as 2018 kicks off?
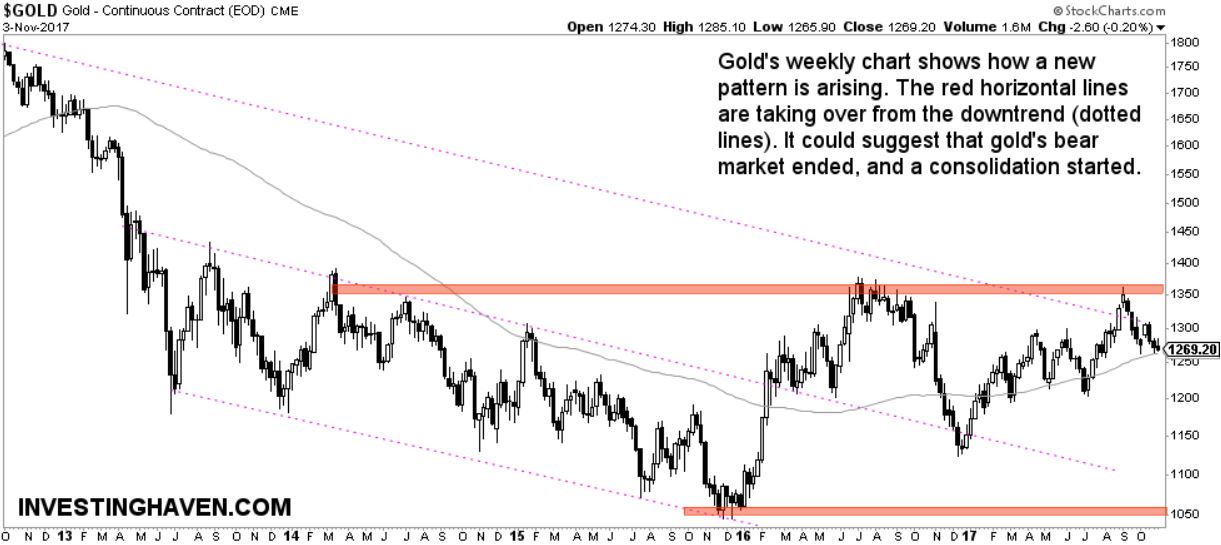
Gold’s potential new consolidation pattern is shown on our weekly chart. Watch how the red horizontal lines seem to be taking over control from the dotted trendlines. As long as gold remains within the red lines it suggests we are in a consolidation (sideways pattern). If gold remains in the dotted pattern it continues its bear market. We will provide much more detail in our gold price 2018 forecast which will be published later this week. For now, suffice it to say that it can go either way.
In the end, it would make sense that gold’s 7-year bear market is making place for a consolidation, before it starts a new bull market (which can be next year or in 5 years, we do not know at this point).
Gold: a tactical breakdown as 2018 kicks off?
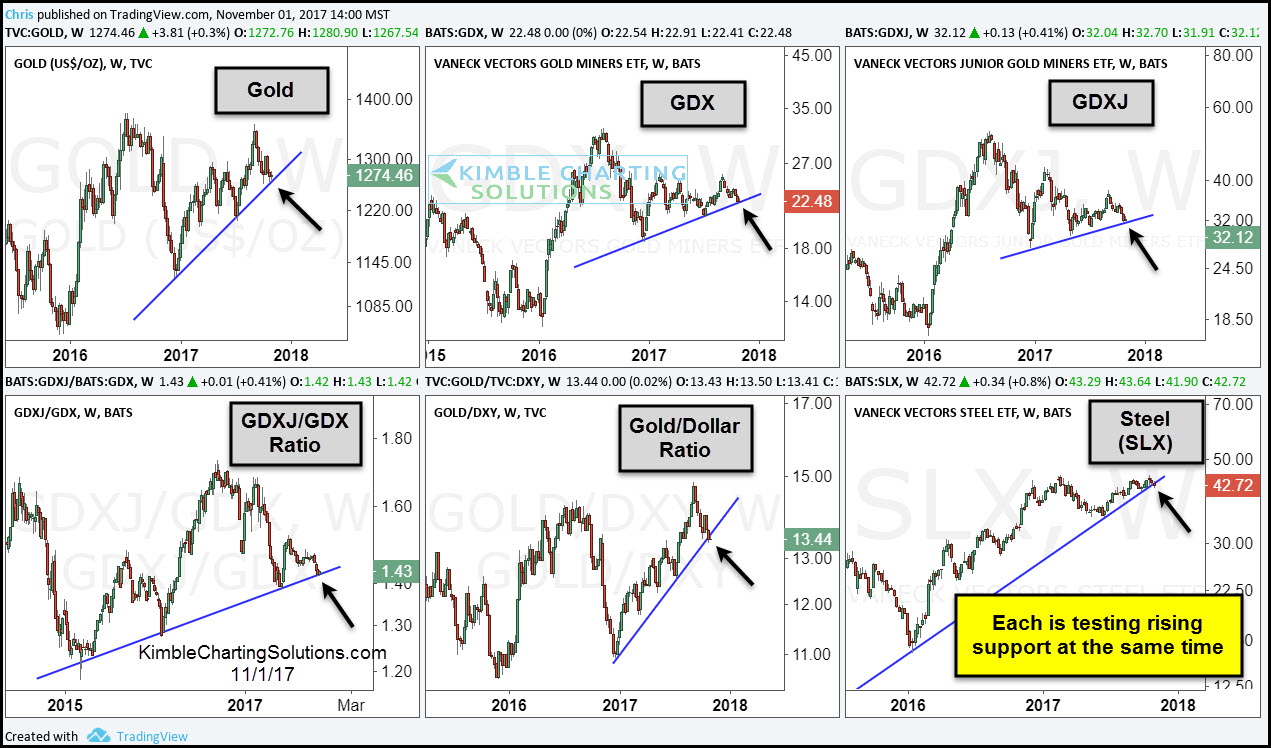
However, the more concerning fact is the risk of a breakdown in gold. Note that it would be a tactical breakdown (in other words on a daily timeframe), not a secular (on a weekly or monthly timeframe).
It does not happen often but in this article we feature a chart from a fellow blogger and investor. He nicely collected several charts in one overview. It shows how the gold market is on the verge of a breakdown as 2018 kicks off. Again, this would be a tactical breakdown, not a secular breakdown. Chart coursey: Kimble.


