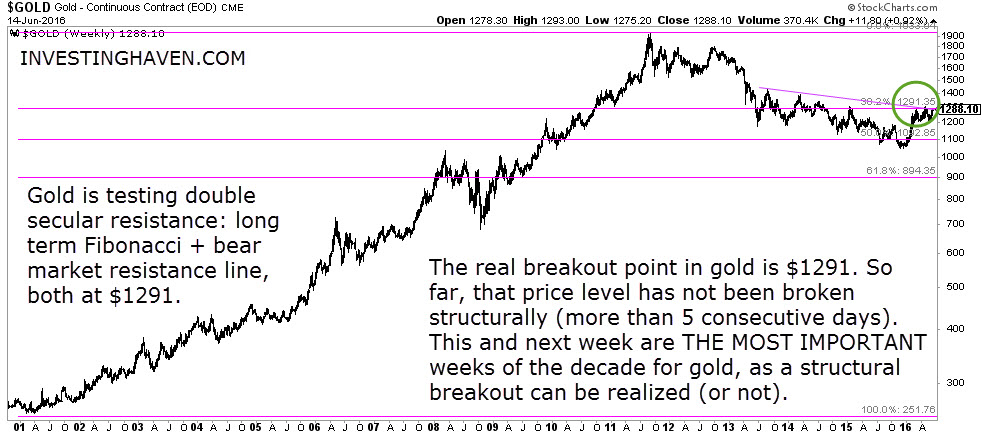
Gold is said to be in a bull market again, but we disagree with that. According to our methodology, gold will only enter a bull market if it will trade for at least 5 consecutive days above $1291. So far, that has not happened, but could happen in June of 2016.
The reason why $1291 is such a hugely important price point for gold can be derived from gold’s long term chart seen below. Basically, $1291 is both a key Fibonacci retracement level for gold’s secular uptrend (from 2001 till 2011) and the resistance line of the bear market. The combination of both has an extremely high importance.
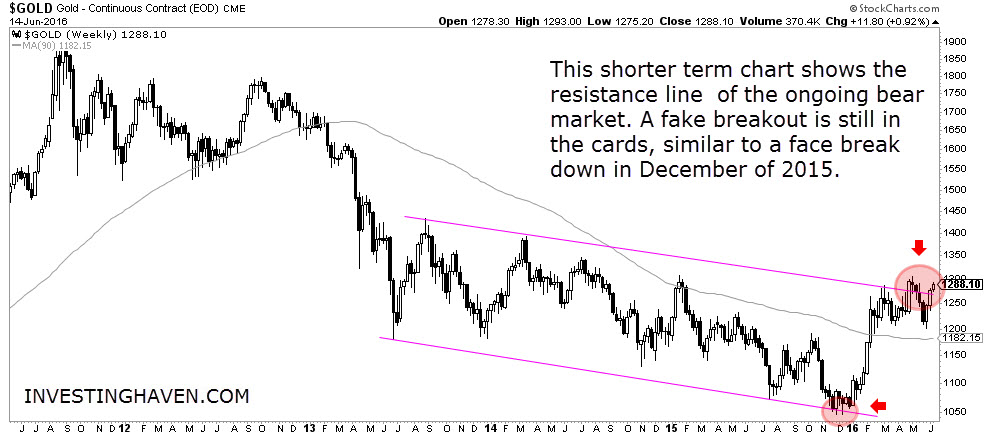
Although the long term chart (above) clearly shows the bear market resistance trend line, it becomes much clearer on the shorter term chart (below). The trend channel which represents the bear market since 2013 is shown on the chart. So far, we have seen several attempts to structurally break through that resistance line, but those attempts have failed. This is similar to the pattern we saw last November and December (red arrow on the chart), where gold showed a number of breakdown attempts which were also false. June 2016, however, seems to become decisive for gold.
Basically, gold has gone nowhere in the last 4 months. Gold stocks have performed very well, but the price of gold is stuck in a tight rage. This is the third attempt for gold to break out of its downtrend. As a rule of thumb the third attempt is mostly a decisive one which is the reason why we believe the coming weeks will be THE most important ones for gold. A failed attempt will bring gold to the lower range of the bear market trend channel, below $1000. A successful breakout will confirm that gold’s bear market has turned into a bull market. That will probably be determined in June of 2016.
That is why we consider June 2016 the most important month of the decade for gold: it will continue or end its bear market, it is a black and white as we put it here.


