Our readers know meantime how we remain focused on price analysis, aka chart analysis.
We do not believe that technical indicators add a lot of value in reading charts. A limited set of technical indicators could be useful, but our focus is on price points, which, combined, create chart structures.
As with everything in life, 20% of price points account for 80% of relevancy, and vice versa. In other words, do not keep refreshing your charts every minute, but focus on the limited number of price points which have a higher importance.
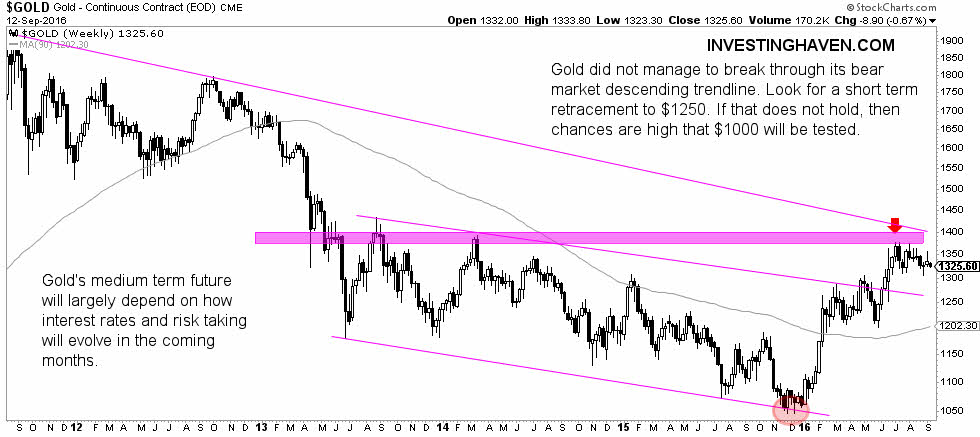
When it comes to gold, by far the most important price point is 1400 USD. As seen on the chart, it represents a secular resistance line, i.e. the one representing gold’s bear market which started in September of 2011 and which connects the peaks since then.
Gold has been struggling once it got near that price point. The fact that it did NOT touch (“test”) that price point is telling, and it learns us that bulls were not sufficiently confident. In other words, the rally since January of this year was already too strong, so a retracement would be coming.
We are closely watching the next important price point, which is 1250 USD. Gold’s behavior around that price point will also be telling. For now, we believe that 1250 will be gold’s next stop.


