We are following the precious metals market very closely. As said earlier this week, the price of gold has to close at least 5 consecutive days above $1,291 in June in order to confirm a bull market. With today’s sell off and Thursday’s sharp intraday reversal, things do not bode well for gold.
What is silver doing meantime? Let’s look at the silver charts to get an idea about the outlook of the silver for the remainder of 2016.
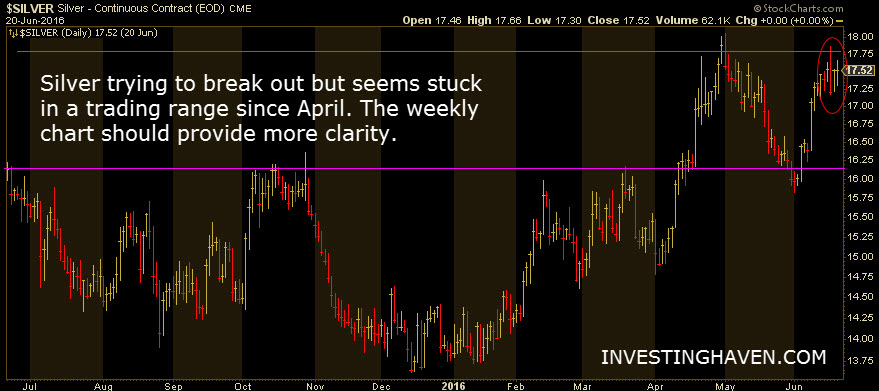
First, the daily chart does not reveal much about the silver price outlook. We observe a tight trading range between $16,25 and $17,75. So far, silver seems to be stuck in that range.
Silver has tested the breakout area but was unable to break through it. With a sharp intraday reversal on Thursday June 16th 2016, setting a lower high, there is nothing particularly bullish about this price at this point in time.
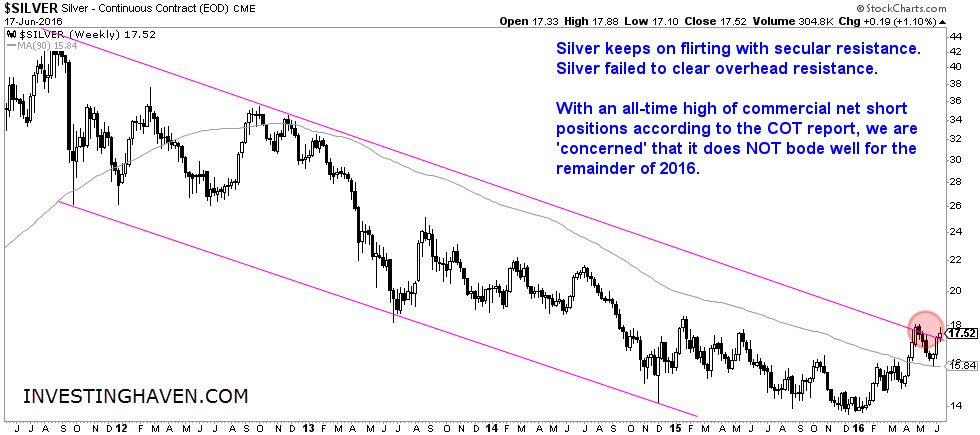
As the daily chart does not reveal many insights about silver’s outlook, we turn to the weekly chart where we see a long term downtrend. Note how silver tried to break out recently, though it was unable to hold. $17.50 is the line in the sand: if silver can trade at least 5 consecutive days above $17,50, the outlook for silver in 2016 will be extremely bullish.
CONCLUSION:
So far, there is no confirmation of a breakout in silver. The silver price should remain at least 5 days above $17.50 in order to have a new bull market. In such a case, the outlook for silver in 2016 will be very bullish. However, so far we only see some unsuccessful attempts for silver to break out. The bearish COT data (details here) suggest that silver will not be able to break out.
We recommend investors to carefully what is happening on the daily, and, more importantly, weekly chart in order to understand the outlook for silver for the remainder of 2016.


