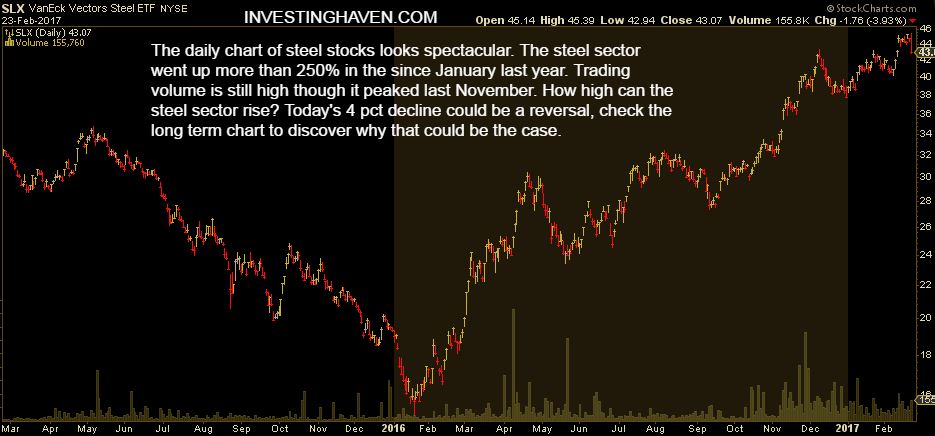
Steel stocks has a big down day. The SLX ETF, representing steel stocks, lost almost 4 percent today.
The daily chart shows the impressive rally since early last year. SLX went up 250 percent in less than 14 months. It was only very recently that steel stocks were pushing stock markets higher. But today’s big loss could mark an important reversal.
The decline of today is visibly strong, it is one of the strongest declines visible on the almost 24-month chart. Is this meaningful or not? Investors cannot derive an answer to that question on the daily chart, so they have to zoom out and verify the longer term timeframe(s).
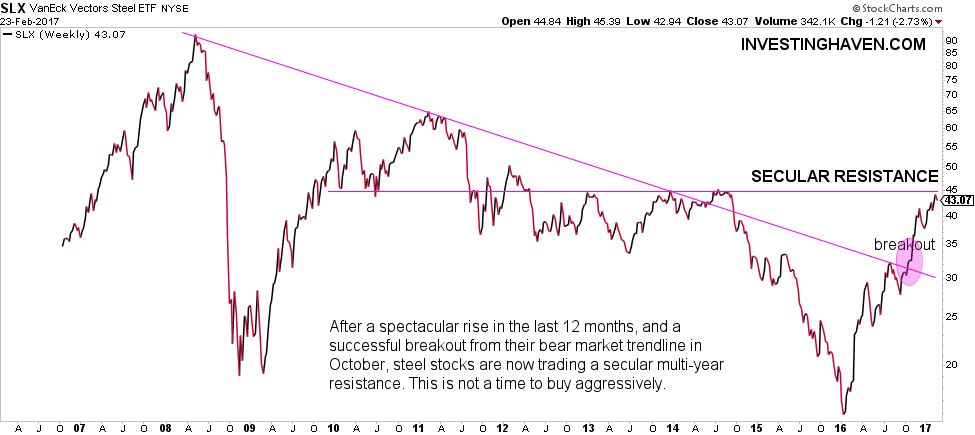
InvestingHaven’s research team answer the question about a potential reversal based on the 10-year chart. SLX arrived at secular resistance in February of 2017. The secular resistance trendline goes back many years, and has significant value as it was tested many times. The rule of thumb is the more times a trendline is tested the higher its importance.
It really is no coincidence that the impressive rally of steel stocks stalled right at 45 points. The long term chart reveals that 45 was STRONG resistance between 2012 and 2014. In 2015, resistance appeared to be so strong that steel stocks fell sharply. No surprise they cannot break out from that resistance level at their first attempt.
The strong decline today right at secular resistance could mark a reversal. If that is the case, steel stocks will soon test their breakout level at 30 points.


