Uranium is considered one of the hardest commodities to forecast especially this year because of the uncertainty around the future of the sector. Our research team decided to take up the challenging task of building a Uranium forecast for 2018 or later.
For 2018, it’s all about Uranium Spot price. The spot price will be the game changer for both Uranium miners (URA) and the sector. We believe we will see the spot price start to rise in 2018 as nuclear reactors operators realize how uranium supplies will become more and more scarce.
Our Uranium forecast for 2018 will include the following:
- Overview of the current state of the sector
- Uranium’s current offer and demand dynamics
- Spot price chart analysis in addition to URA and our Top 2 Uranium miners.
Before we dive into the fundamental data and charts, we would like to remind our readers that investing in Uranium and Uranium miners equities is very risky. There is a serious potential for loss if the timing is off. Therefore, we urge our readers to do their due diligence and make sure they research and know what they are investing in.
First, the Current State of the Uranium Sector
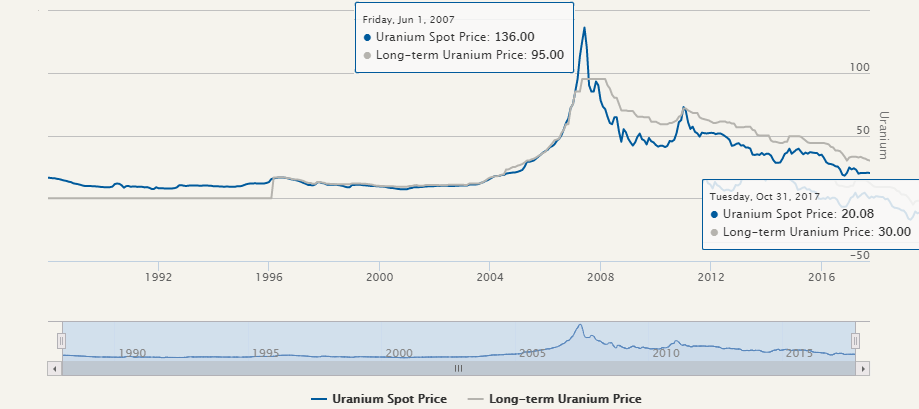
As shown by the chart below, Uranium spot price took a dive after a spike in 2007 to reach 136 USD. The spike was mostly due to a bidding war among reactors’ operators to secure long term contracts as the were concerned there might be a shortage in uranium supply.
Since then, many analysts have been trying to predict or call the bottom and today, the spot price is at 20 USD. Many companies didn’t survive hence our call for due diligence and managing risk.
Uranium Forecast 2018 : Supply and Demand Outlook for 2018
The most important factor impacting the demand will be new reactors coming online and existing reactors being recommissioned.
According to Cameco (CCJ) at press time, 56 nuclear reactors are currently under-construction with 19 in China.
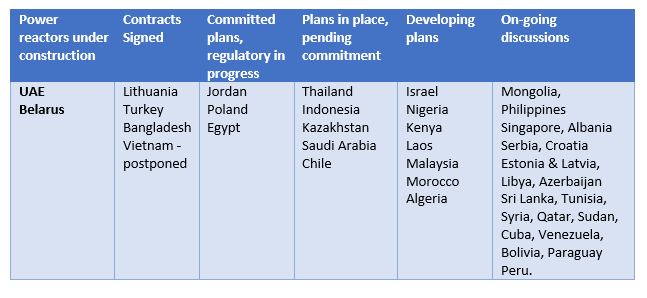
Furthermore, the world nuclear association announced many emerging countries are considering nuclear power as an alternative to reduce pollution especially as electricity rates are skyrocketing. Just in the UAE, 4 reactors are under construction. One is 96% completed and scheduled to start as of 2018, The second and 3rd reactors are 86% done and the 4th one is 56% done.
The chart below illustrates the progress of nuclear power adoption in emerging countries:
We expect the offer to drop as more and more players are unable to survive the depressed spot price and major players are reducing their output till prices are back in a more profitable range.
- Kazakhestan, representing 21% of world production in 2016, announced early 2017 reducing its Uranium output.
- Canadian Cameco, representing 17% of world mine production is now announcing production cuts.
Spot Price Outlook based on Supply and Demand
Based on the above, it is hard to pinpoint exactly when the spot price is going to recover. Particularly given the structure of Uranium contracts. Many long-term contracts are currently up for renewal and since the short term uranium price is so low, they are either being cancelled or not renewed. As bearish as that might seem in the short term, it is important to take the fact that the reduced output and lack of long term contracting, paired with all these new reactors currently being built could lead to a sharp price reversal.
Here is how:
Ux Consulting Company, LLC (UxC) reports that over the last four years only 245 million pounds have been locked-up in the long-term market, while over 635 million pounds have been consumed in reactors. As annual supply adjusts and utilities’ uncovered requirements grow, the pounds available in the spot market won’t be enough to satisfy the demand.
From history, we refer to the Uranium Bubble of 2007 and how Uranium spot price surged more than 3 folds within a year. It was all about securing long-term contracts once the supply was expected to become more scarce. In fact it takes years for new production to be ready and nuclear reactors operators have to secure supply at a minimum 3 years before it’s needed.
What is interesting to note is how other major miners such as Cameco, are announcing a strategy similar to UEC’s.
Cameco’s Tim Gitzel mentioned recently in Q3 2017 Earnings call:
At today’s prices or the prices used in those reports apart from making sure we have uranium to fulfill our contract commitments our supply is better left in the ground.
We know UEC, our top pick is set to profit from a Bullish move in the Uranium sector as they have been for a while now saving their production till they can sell at a profitable price.
Gitzel also added:
Experience has thought us that success in our business requires patience and discipline.
Same applies to investing in the Uranium sector. It is fair to expect solid gains from this sector but one needs to be able to hold, be patient and potentially stomach some steep declines.
In terms of Threats to our Uranium Forecast 2018, decommissioning more reactors could cause more declines in the spot prices. One decision in particular that we are keeping an eye on is France potentially closing 25% of its nuclear reactors – decision by end of 2018. That is of course in addition to watching what’s going to happen in Japan.
Uranium Miners Outlook for 2018
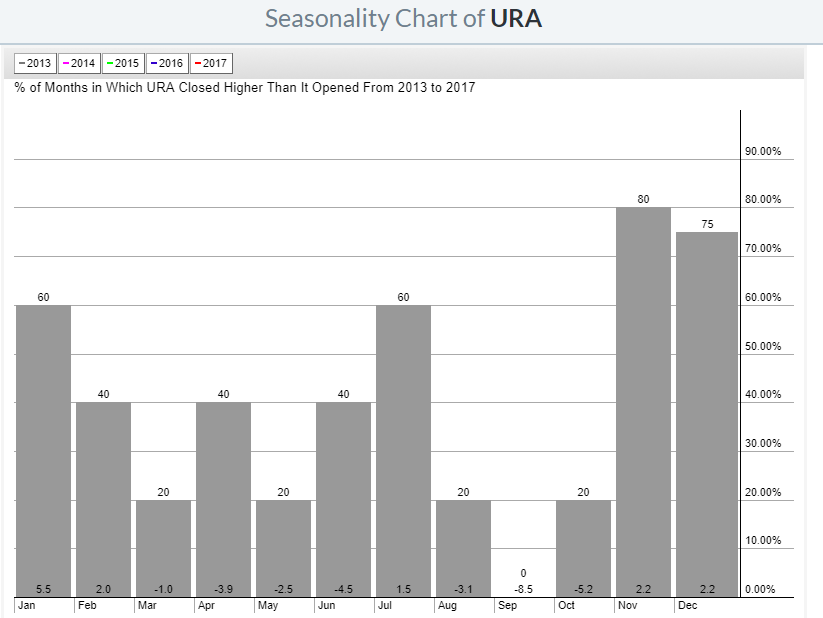
Our Uranium miners outlook for 2018 starts with seasonality. We believe, based on the analysis of miners charts that the next 2 to 3 months will be good for Uranium as a sector and some Uranium miners in particular. This outlook is also corroborated by the below seasonality chart.
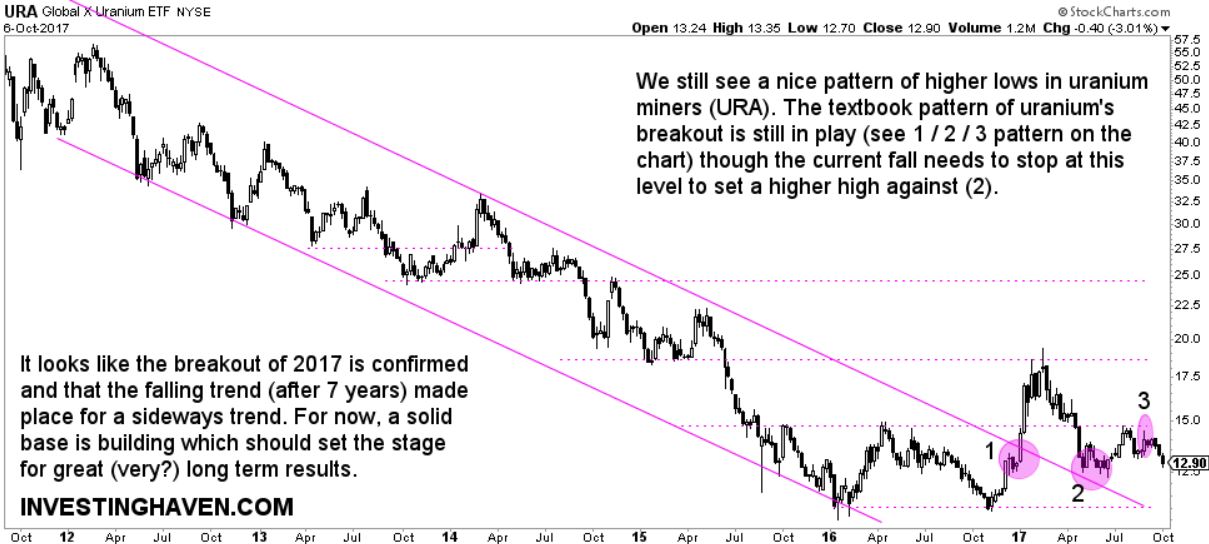
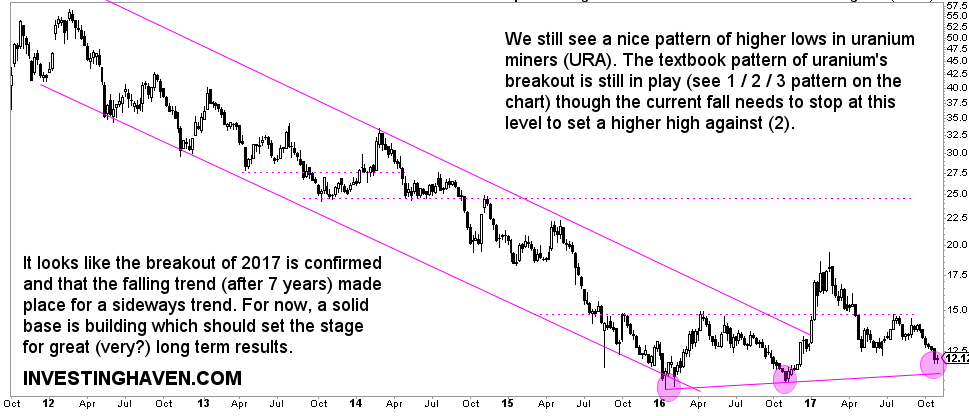
URA
URA has been on a steep downtrend for years. 2016 and 2016 were the start of a new trend where the price shifted from a downtrend to a sideways movement. 15 USD remains the level to break for URA to move higher.
If the 15 USD level is Broken, 20 USD could be reached but for that to happen, the price should hold above the horizontal support line in purple.
As our readers know, URA’s Top holdings are Cameco (CCJ ; CCO.TO) and Nexgen Energy LTD (NXE.TO). They represent 35% of URA’s holding. Our Uranium forecast for 2018 cannot be complete if we do not look into their individual chart.
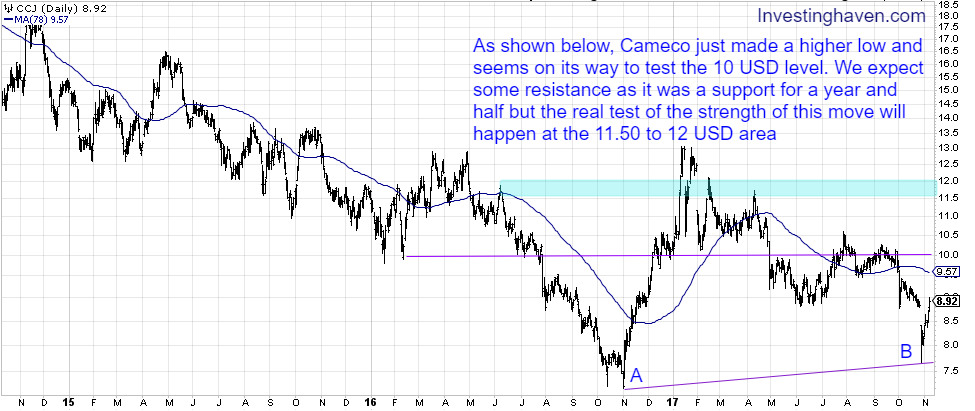
Cameco’s Price chart
As shown below, Cameco just made a higher low and seems on its way to test the 10 USD level. We expect some resistance as it was a support for a year and half but the real test of the strength of this move will happen at the 11.50 to 12 USD area
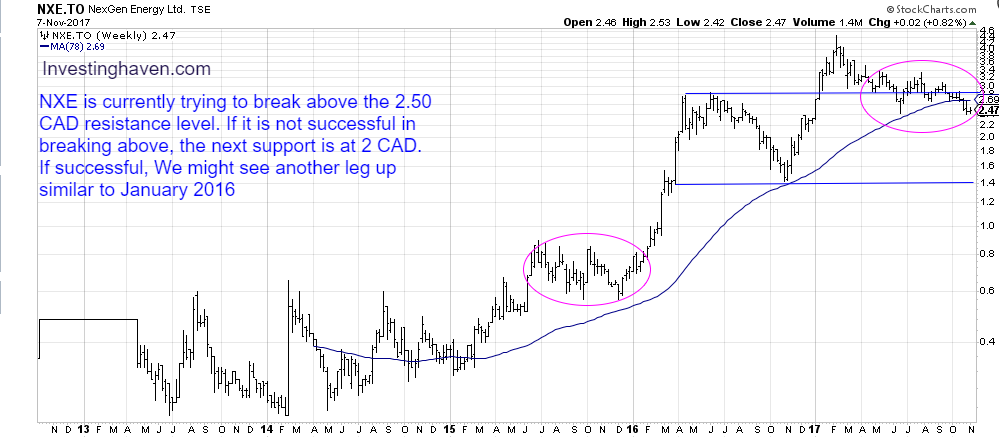
Nexgen’s Price chart
NXE is currently trying to break above the 2.50 CAD resistance level. If it is not successful in breaking above, the next support is at 2 CAD. If successful, We might see another leg up similar to January 2016.
To conclude, Both Cameco and Nexgen seem to be at a crucial point. The main factor at this point is the Uranium spot price as that’s what’s going to dictate the next direction in the Uranium sector. We believe the tide might be turning for Uranium price and for Uranium miners as the cuts we are seeing now in production along with the potential new reactors coming online will force a change. For a cautious Uranium play, one can buy on strength.
Our top pick remains UEC and we will cover it in a separate article.

