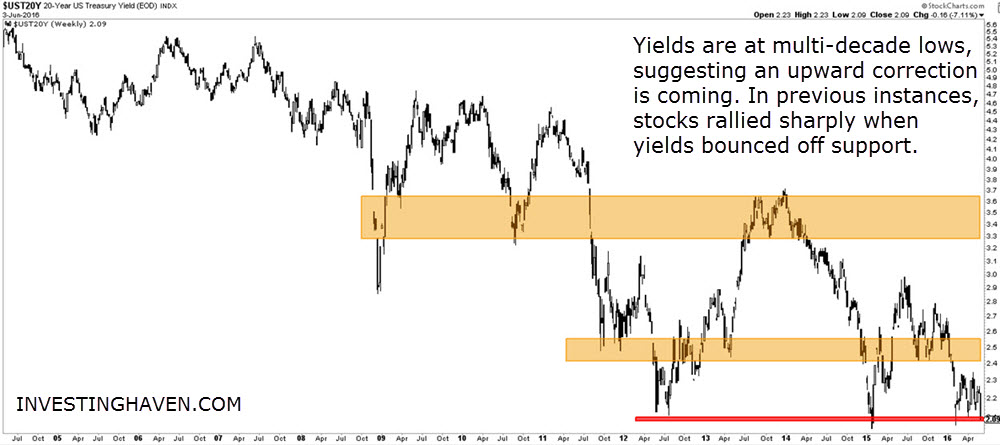
The bond market has done extremely well, at least for bond holders. 20 Year Treasuries are trading at all-time highs as yields are at all-time lows. That is definitely odd as the U.S. Fed keeps on hinting that they will raise rates in 2016 and beyond. As the Fed talks about rate hikes, yields go lower.
But how much lower can they go? Basically, we see two potential scenarios unfolding.
One scenario is that yields would fall through their long term support, which would imply they would truly collapse, as bonds would rise in a parabolic fashion, in the opposite way as they did in 1980. Yields would be negative across the board. That would imply that real rates would go up, provided that inflation would remain AS-IS, and inflationary hedges like gold would go parabolic. We believe there is a 10% probability of this scenario to play out.
The other scenario is that yields would bounce off support, similar to 2012 and early 2015. That would trigger a ‘risk on’ sentiment among investors, sending stocks much higher. We believe there is a 90% probability that this scenario will play out, based on our risk indicators which are becoming increasingly bullish.
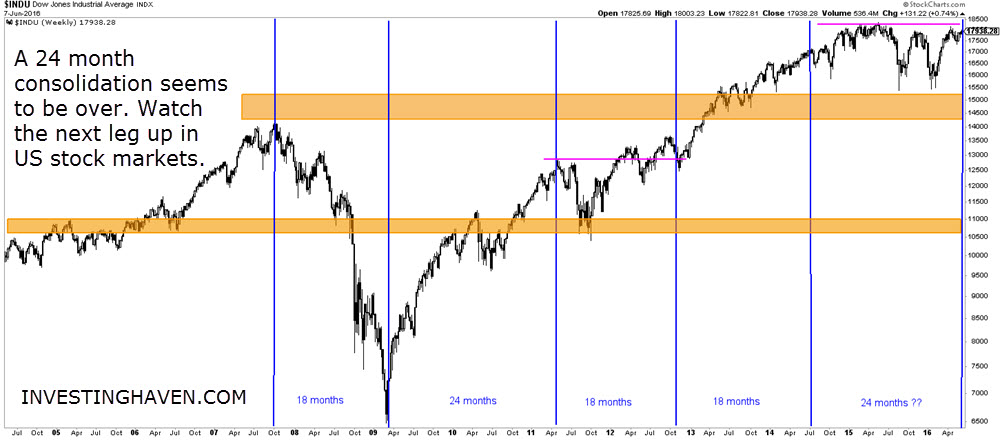
Now it is really no coincidence that stocks are about to break out (chart below), right at a time when yields are testing all-time lows (chart above). The chart of the Dow Jones Index confirms the view and conclusion we derive from the 20 Year yield chart.
Moreover, and even more interesting, is the timing aspect. We are all familiar with the 18 to 24 month cycles. U.S. stocks are about to spend 24 months in a consolidation period, and, right at the end of that period, they are set to break out. As seen on the chart below, 18 to 24 month cycles have coincided with uptrends, downtrends or consolidation periods. It seems that the current consolidation cycle is about to end, and a new uptrend is about to start.
We believe stocks are ready to start a new upleg. Bonds would come down in that scenario. Commodities would be neutral at best.


