U.S. stocks hit another all-time high this week. It is also small caps joining the party now, which is a very good sign as they are the ultimate ‘risk on’ indicator.
However, InvestingHaven’s research team starts getting concerned about the ongoing evolution, particularly for 3 reasons listed in this article.
First red flag: Complaceny (sentiment indicator)
From a sentiment perspective, we observe an overly bullish environment. Let’s be very clear on this: complacency is bearish, strongly bearish. From an anecdotal perspective, social media is full of bullish messages, and that is certainly not smart money, let that be clear.
The most reliable indicator in markets is one inside yourself. As an investor you have to step back for a second, on a regular basis, and get aware of your inner self. What’s the message you get from your emotions? Right now, even our team with several decades of experience is experiencing this feeling of complacency. It is normal human behavior but the trick is to recognize it and use it as a piece of information (as opposed to go with the flow of your emotion).
Admittedly, it feels good turning to the charts and see them most of the times in green. Without any doubt, it is great checking your portfolio or stock account, and seeing it grow week-over-week. Once you get to the state to check your portfolio and the charts in order to get this bullish feeling, you must consider this as a red flag. This situation, probably recognizable to all of us, should be treated like any other indicator out there.
As a reminder, InvestingHaven’s team wrote this timely piece, and should be consulted in times like these when a correction seems brewing 3 Investing Tips To Control Emotions.
Second red flag: 20-year yields (risk indicator)
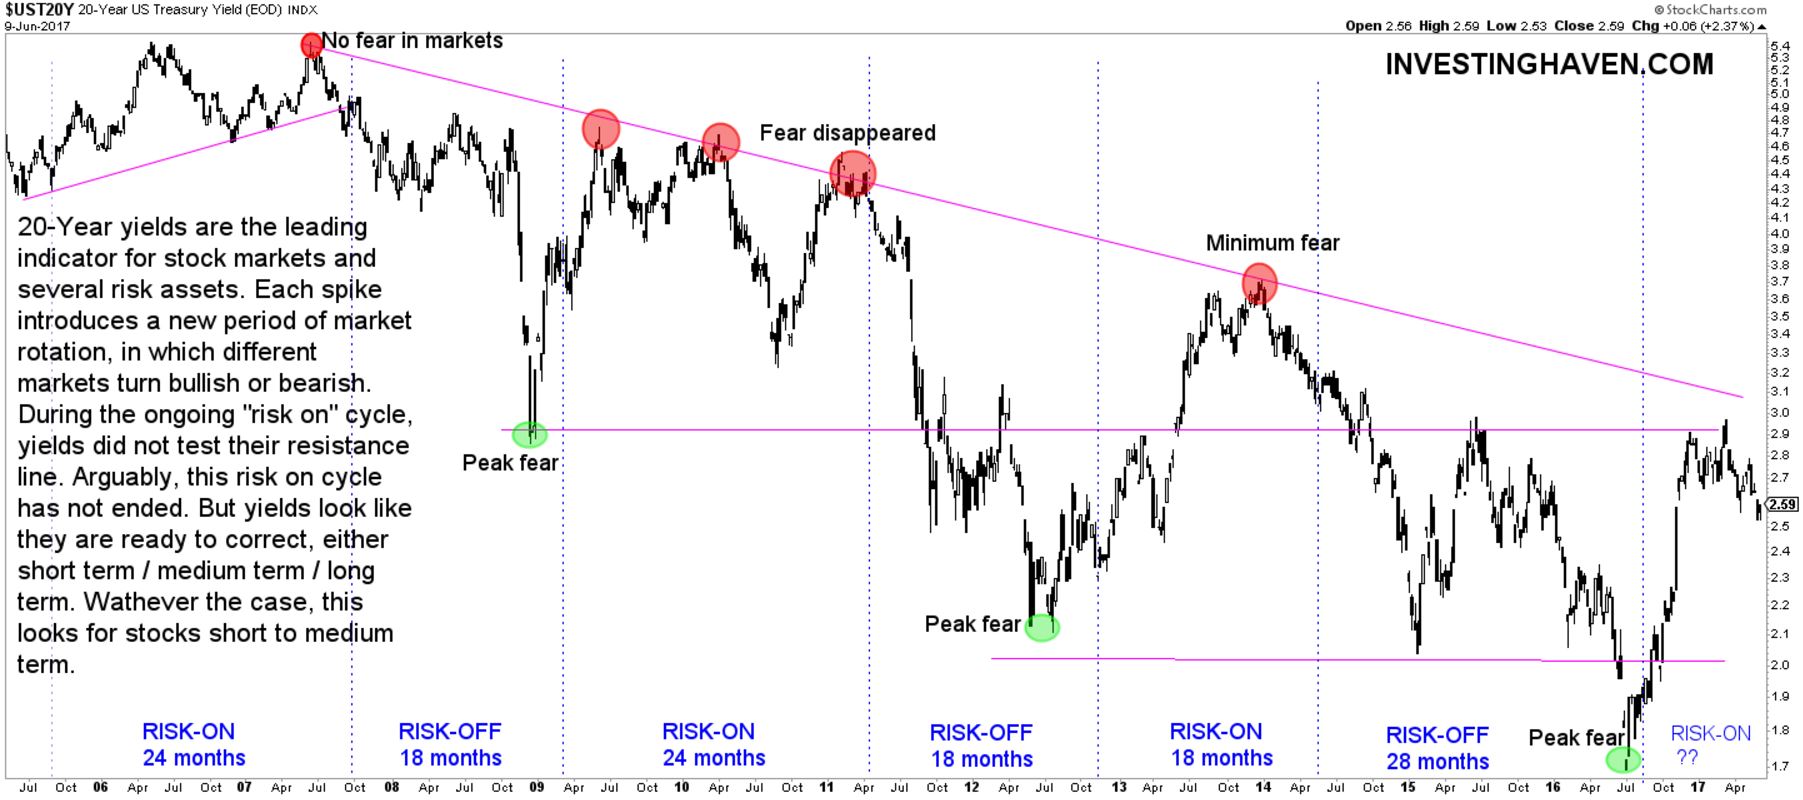
InvestingHaven’s methodology considers 20-year yields as a leading indicator for stock markets. As explained more than half a year ago the Market Outlook for 2017 was bullish according to our proprietary indicators. That was right after the dip in 20-year yields in the chart pattern shown below.
Right now, it looks like yields will go lower again, which is bearish for stock markets. The reason we become bearish is that the strong rise in yields at the end of last year (gap higher) is likely to be tested now with lower yields as a result (at least, short to medium term).
Smart investors are watching how deep such a retracement will go as that will be telling for the next bullish or bearish wave in stocks. In the meantime, a more defensive stance is required.
The summer top and fall correction could play out faster than JP Morgan indicates on CNBC.
Third red flag: bellwether stocks extended profits
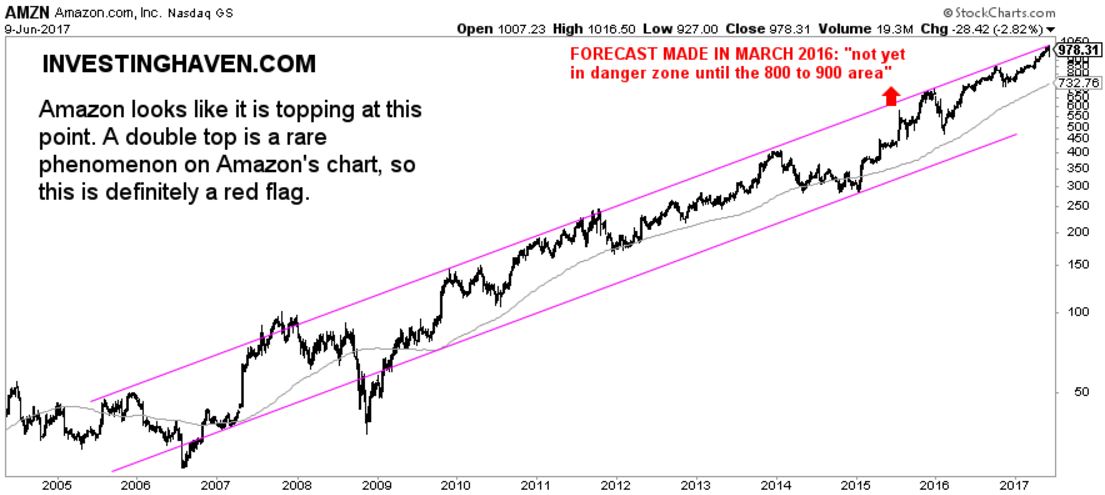
From an individual stock perspective we see several bellwether stocks reaching their resistance area on their secular channel. The most illustrative example is Amazon. Note how we forecasted more than a year ago that Amazon would be overly bullish (become bearish) once in 800 to 900 area. After touching $1000 we believe Amazon (like several other bellwether stocks) are overextended.
Here again, complacency is visible, and that is a bearish sign, for sure short to medium term (not yet long term).
Moreover, along the same lines, CNBC notes that bellwether stocks Facebook / Apple / Google / Netflix (FANG) have added a total of $600 billion of market capitalization this year. “The group makes up about 13 percent of the S&P 500, but has accounted for almost 40 percent of its year-to-date performance. The stocks are among the top holdings of hedge funds. The analysts noted that mutual funds, aimed at core, growth and value, are overweight all but Apple, and the five companies combined are 11.8 percent of those mutual fund holdings.”


