The seasonally weakest months of the year for stock markets are nearing. Typically, stock markets suffer in September and October. After last week’s alert we see another short term indicator flashing red.
As opposed to this article we are not focused on technicals but on intra market indicators which we believe are better in forecasting.
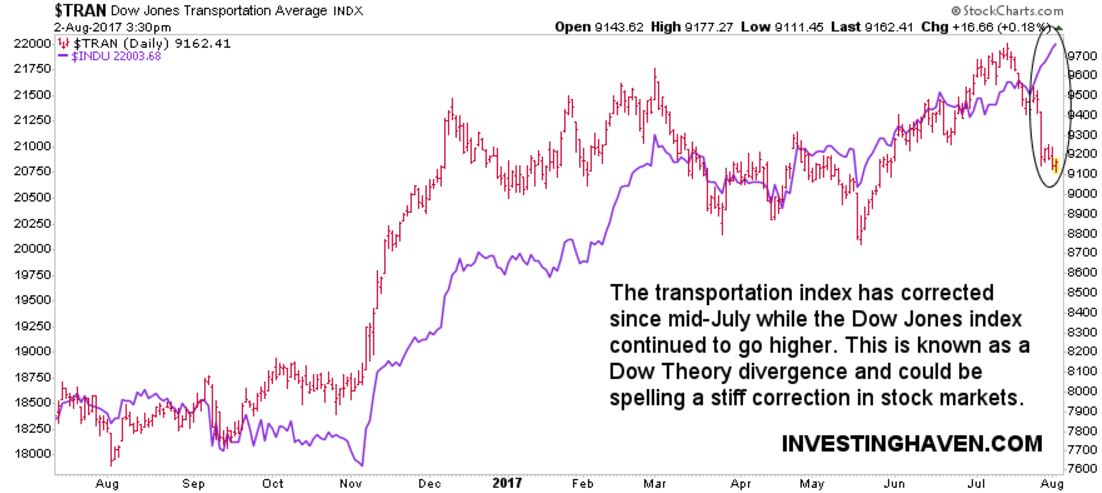
First, the Dow Jones index is diverging from the transportation index. According to the Dow Theory this is bad news. Transportations are a leading indicator, so stock bulls do not like to see this divergence occurring.
This is a short term indicator with, most likely, short to medium term implications. If this divergence continues it could certainly confirm a stiff Sept/Oct retracement.
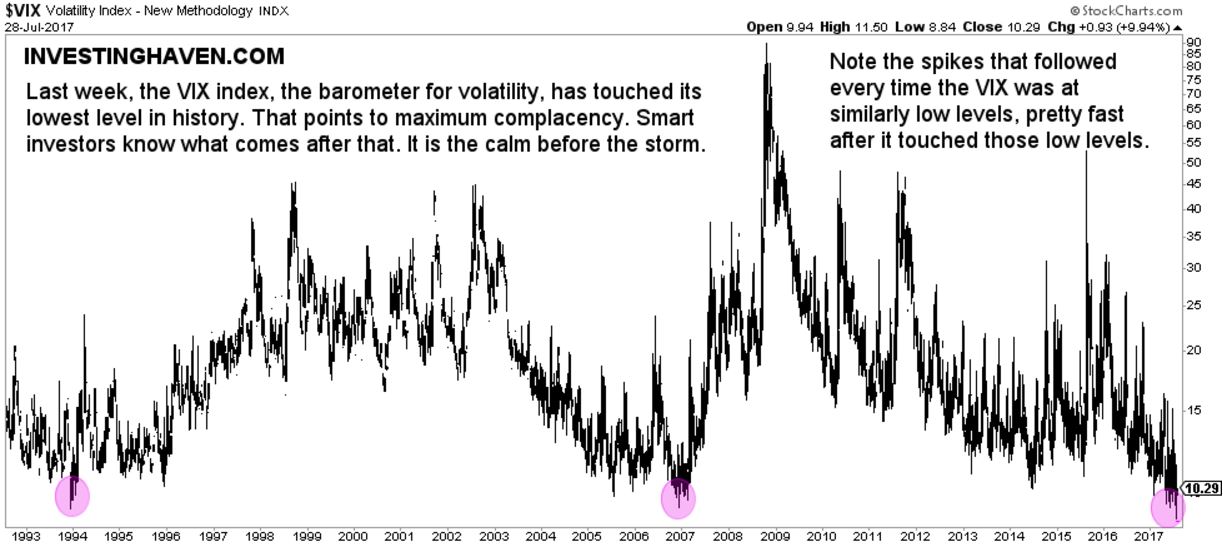
The second concerning indicator is one we discussed a couple of days ago in Volatility Hit Historic Lows This Week. Maximum Complacency Is Bearish. This is the most important quote and conclusion from that article:
Does that suggest that markets will crash? That is certainly NOT what we are suggesting. We are saying that historically low volatility will not last long. As volatility picks up, it bears watching which markets and segments do well and which ones sell off. For instance, it could well be that gold will act as a fear trade in the coming months (if that is the case, it will be reverse its long term bear trend into a bull trend) and that bonds will outpeform …
The ultra low volatility, lowest in history, suggests that this will not last. As spikes have always followed these very low volatility readings we would not be surprised if the Sept/Oct correction would come with this spike in VIX.
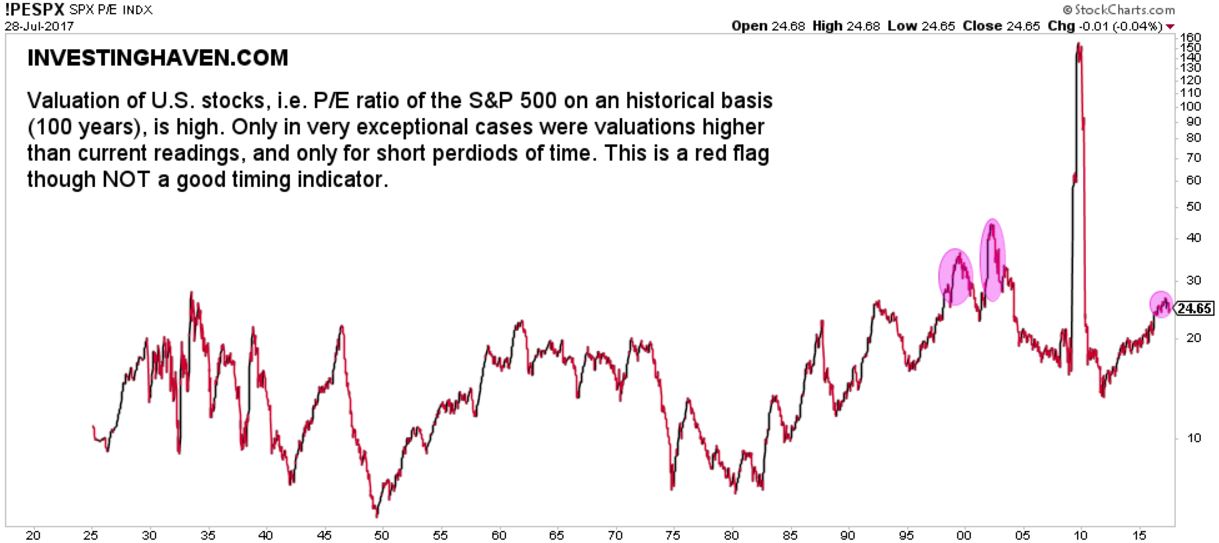
The last indicator is a very long term one. This is certainly NOT a good timing indicator, but we bring it up because it could suggest that U.S. stocks have had their best days, and that underperformance to other markets (think of emerging markets) could be starting.
The P/E index of the S&P 500 on 100 years shows that this is the 3d highest reading ever. This is a valuation metric so more fundamental in nature. Note how only a handful of times in the last 100 years similar readings were reached, and they coincided with major stock market peaks.


