As forecasted by Investinghaven, India’s stock market had a stellar performance in 2017. India’s NIFTY 50, representing 50 of India’s large capitalization started 2017 at 8000 to recently cross above the 10000 level. INDY, iShares’ India 50 ETF tracking the performance of NIFTY 50 is up more than 30% for the year.
In our article today, we will cover the performance of NIFTY 50 (NIFTY) and important price levels to watch. We will also look into the recent tracking divergence Between INDY and NIFTY 50.
NIFTY 50 Outlook Based on Chart Setup
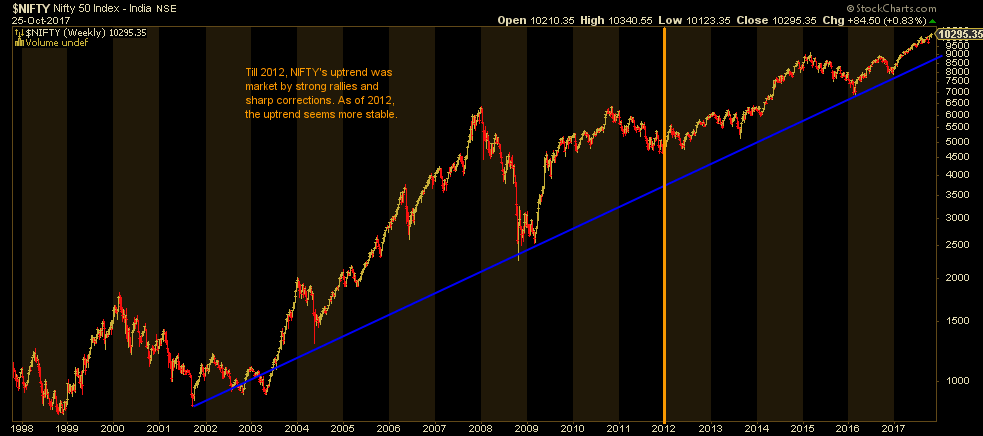
NIFTY 50 has a long term Bullish chart setup. That doesn’t rule out the healthy pullbacks and as we notice from the chart below, NIFTY’s corrections are less and less pronounced, especially after major runs.
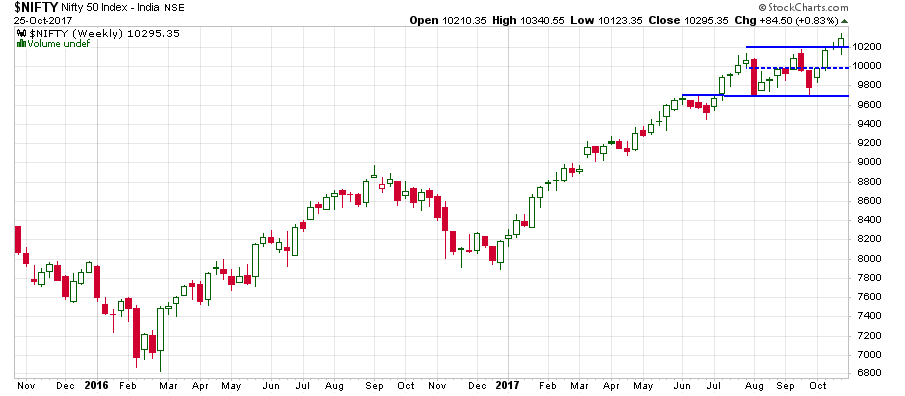
Zooming in to look at the recent performance, we see a sideways price movement happening since June 2017, which could be the base for another uptrend end of 2017 and early 2018.
In short, These are the NIFTY 50 important price levels to watch:
- 10000 remains the price level to watch for NIFTY 50 as we have a support area between 10000 and 10180.
- A break below 9700 could signal an important correction similar to September 2016 before the resumption of the uptrend.
- Remaining above 10000 is definitely positive for the price action to come. For those with a higher risk tolerance, trading above 9700 is still positive.
NIFTY 50: A Fundamentally important factor to consider
India announced the following yesterday, Tuesday October 24th:
Over the next two years, New Delhi plans to pump in 2.11 trillion rupees (about $32 billion) into public sector banks in a bid to increase money flow, loosen credit conditions, and boost investment and growth.
The government plans to finance 1.35 trillion rupees ($20.7 billion) by issuing bonds. Another 760 billion rupees ($11.7 billion) is set to come from the budget or the institutions’ own fund-raising efforts.
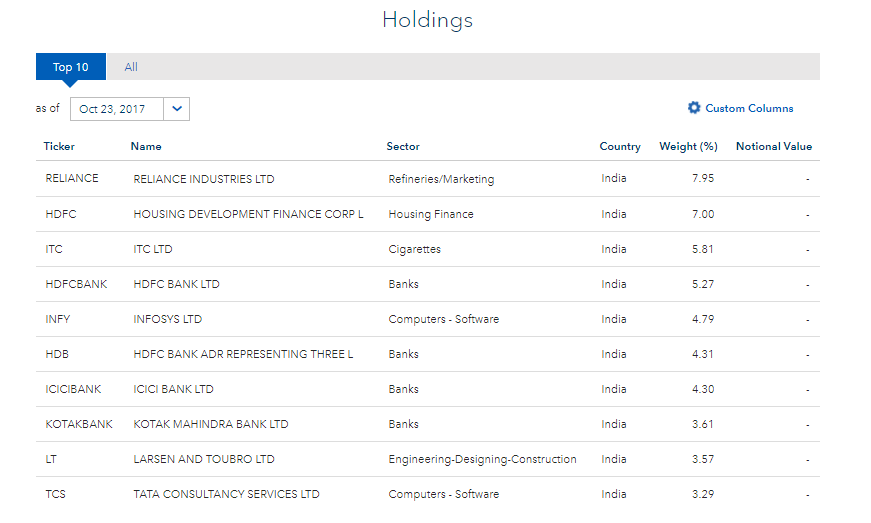
This is important news for NIFTY 50 and INDY. As Of October 23rd, 4 out of INDY’s Top ten holding are in the banking sector. The banking sector represents 25.70% of INDY’s total holdings. If we factor in the housing finance sector that should benefit as well from loosening of credit rules, we are at 30%. NIFTY 50 has a significant representation of banks as well.
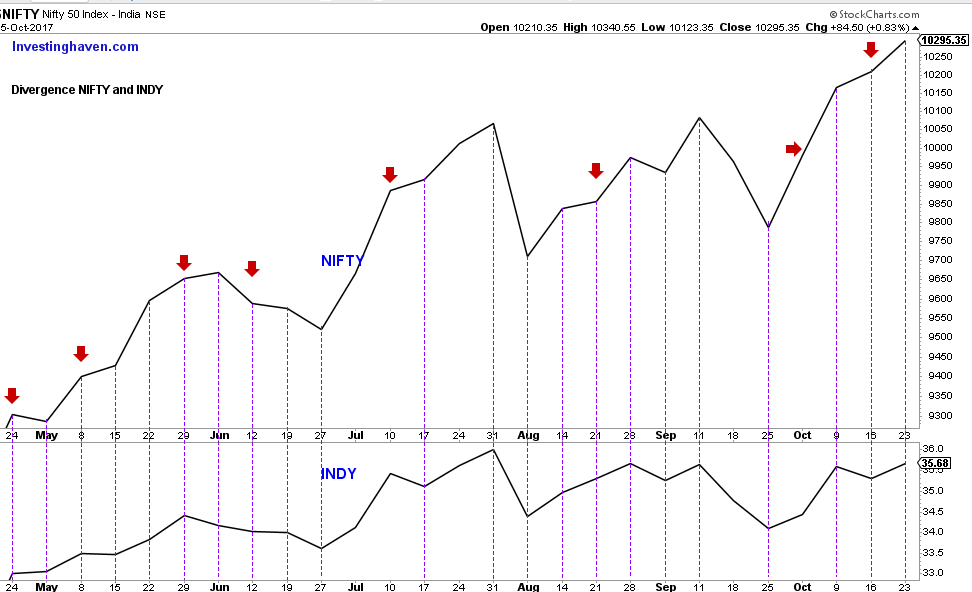
Nifty 50 and INDY recent Divergence
Last week, we received an interesting question and insight from one of our readers regarding the divergence in INDY’s tracking of NIFTY 50. The divergence is shown in the chart below.
Our Reader JB noticed the divergence reached out to Ishares and shared the following with us:
It’s (the divergence) caused by the limited ownership rules that the India market puts on foreign ownership of domestic stock. It forces an unavoidable tracking error due to holdings differences. Sometimes it favors the ETF and other times it favors the index. Currently the index is benefiting.
So is this divergence normal? Concerning? Not necessarily concerning. It is rather normal given the rules regulating ETFs holding.
According to the Ishares prospectus
As a result of investing in non-U.S. securities, the Fund may be subject to increased risk of loss caused by any of the factors listed: Lower levels of liquidity and market efficiency; Greater securities price volatility; Exchange rate fluctuations and exchange controls; Limitations on foreign ownership of securities; (Which is what they referred to in their response to JB); Higher transaction and custody costs and delays in settlement procedures.
This is one of the main reasons why traders and investors need to make sure they chart the index and not just the ETF for a fair evaluation of the price action. This should allow them to assess the actual underlying market and decide if it is turning bearish or not.
Conclusion
To sum it up, we’ve frequent tracking divergences between INDY and NIFTY 50 but on the longer run, it tends to average out.
From a price action perspective, INDY as well as NIFTY 50 seem rather Bullish. The Indian government 32 Billion Dollar injection will alleviate some of the pressure from bad loans. I will also boost the local economy for the mid term. The question is: For how long.

