“Sell in May and go away, but remember to come back in December.”
That is a very old saying when it comes to stock markets. There certainly is sufficient measurable proof of that. When it comes to seasonality, the U.S. stock market is known to follow a seasonal pattern most of the times. Of course, this seasonal pattern is not true 100% of the time, but rather 80% to 90%, as there are no 100% certainties in markets, period.
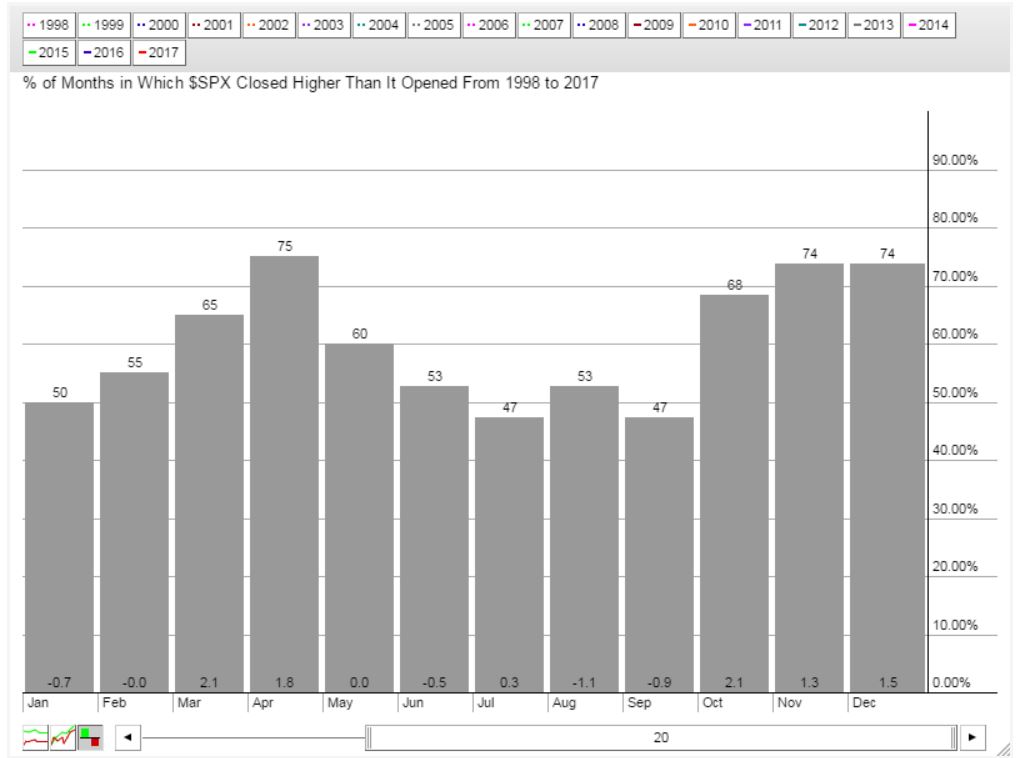
The S&P 500 seasonality chart makes the “sell in May and go away, but remember to come back in December” point. Over the last 2 decades, April has closed higher 75% of the times, while May closed lower 60% of the times. June till September closed lower 50% of the times. That is how to read the following chart.
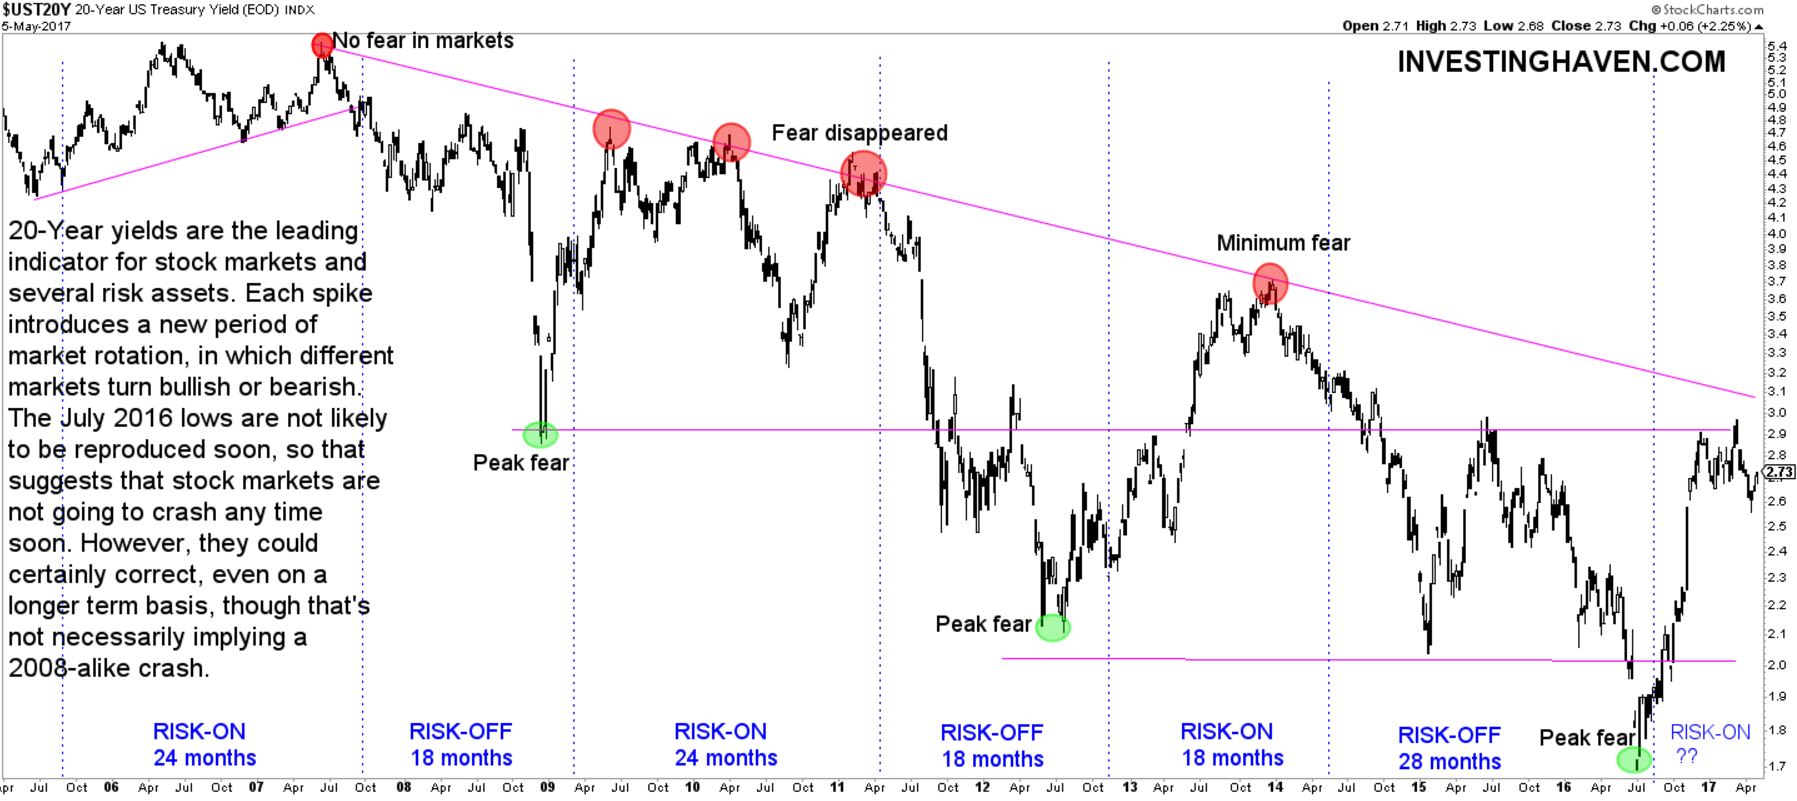
InvestingHaven’s methodology consider 20-year Yields as a primary (leading) indicator for stock markets. It tends to peak to the upside when there is extreme compliance, and to the downside when there is extreme fear, within the pattern visible on the chart.
Right now, Yields are close to peak to the upside. That implies that the probability of a market correction grows higher.
Interestingly, this is happening at a time when safe haven assets are weakening. That could mean one of these two things: either markets are close to maximum compliance, or or the rules of the game are about to change. The case of the latter scenario was made by InvestingHaven’s research team in Disruption Ahead In Stock And Bond Markets.
Both from a valuation perspective and volatility perspective, we believe that U.S. stocks are in a sell area, not a buy area. There is plenty of other markets that provide much more long term value to investors, first and foremost emerging stock markets which will be bullish in 2018.
All in all, the summer of 2017 should not be time with lots of buy positions in U.S. stocks. Also, 20-year Yields should be monitored closely as a secular trend change which would have major implications is certainly a possibility.


