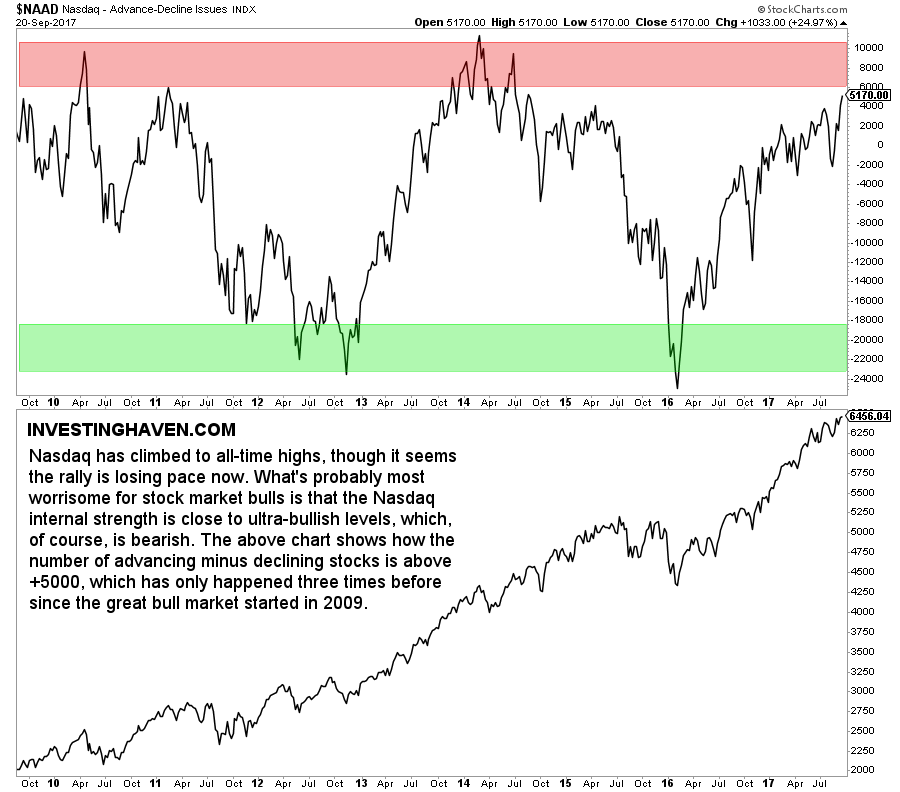
The Nasdaq is doing great. It trades one percent below all-time highs, that must be bullish, right? Potentially wrong, we would answer, and we base our answer on Nasdaq market internals.
The Nasdaq daily chart shows how the index is now flattening. That is not a good or bad thing on its own.
However, the internal strength is a great indicator which should be read in combination with the price chart. Market internals refer to internal strength, within a market or index.
There are several market internals like the number of stocks trading above their 200 day moving average, the percentage stocks declining vs rising.
One of our favorite market internals is the number of stocks advancing minus the ones declining. That indicator is now about to enter an ultra-bullish area. As we all know: ultra-bullish equals bearish.
The upper part of the chart makes our point. The number of Nasdaq stocks advancing minus the ones declining is now +5170. In 2016 that number was below zero throughout the whole year.
There have been only 3 instances in the last 8 years, since the great stock bull market started, in which the number of stocks advancing minus the ones declining went above +6000. That was early 2010, early 2014 and mid-2014, for just a couple of weeks.
Note that this is not a good timing indicator. It merely indicates that internal strength is fading. In conjuncture with maximum complacency because of the Volatility Index Making A Higher Low means to us that we should we careful. This is not a time to become aggressive in U.S. stock markets.
As said many times before, we prefer the emerging markets play and believe capital will be rolling out of U.S. stocks into emerging markets with the next stock market correction.


