The Russell 2000 (RUT), the Small Cap Index is Breaking out in 2018. This is an important event for investors in the US and around the Globe and only means one thing: The strength in the US stock market is here to stay as per our Most Important Chart Of This Decade.
What is notable about this breakout is the timing and chart set up. Regarding the timing, this performance is important because it is happening in the midst of the “North Korean Soap Opera Diplomacy“, talks about Trump tariffs On EU Steel and Aluminum and many more “captivating” stories by financial media.
So while many investors are concerned over what’s happening in the world and trying to figure out the impact of the noise on the market, Russell 2000 and small caps in the US are breaking out, which only means one thing: Strength in the US Stock market, investors’ risk taking appetite is obvious and US equities will likely go higher from here.
To make such a bold assessment, we base our perspective on the Russell 2000 charts below offering both a long and short term perspective on the price performance.
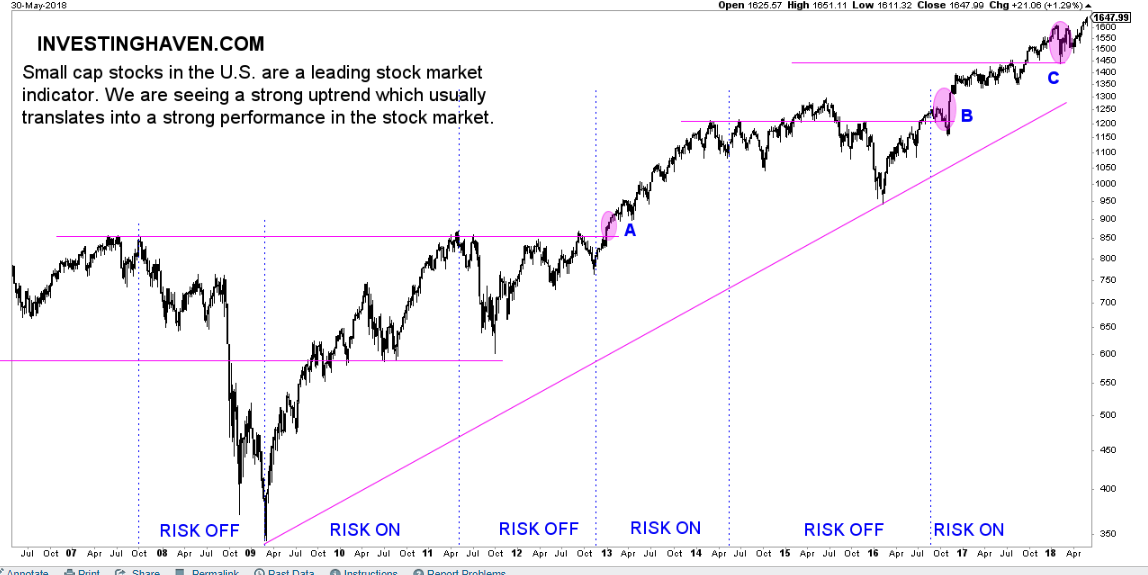
Leading stock indicator’s long term chart suggests uptrend likely to continue
The chart bellow shows how the index is in a strong uptrend since 2009. As annotated in the chart, C , which is the sharp retrace earlier in 2018 was a successful back test of the previous Breakout level, which is very constructive for the long term uptrend. Therefore, the uptrend is likely to continue.
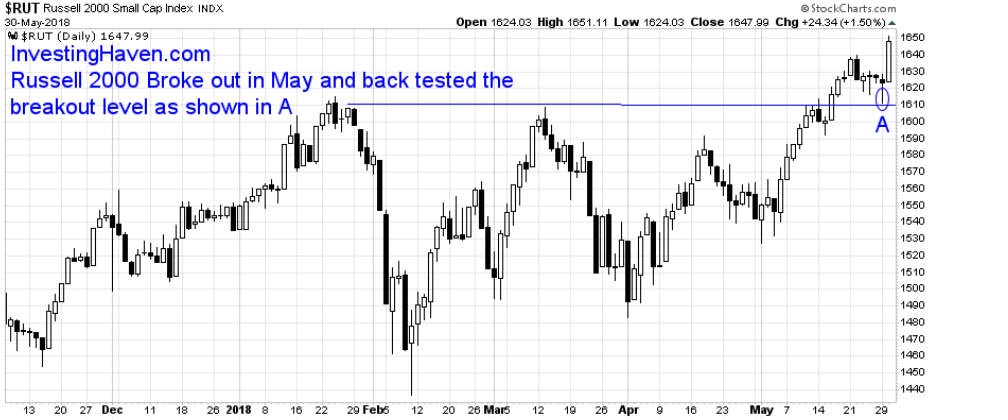
When we zoom in to look at the performance of Russell 2000, we see that this is a triple top breakout. We also note how there is already a successful back test that just took place (annotated in the chart below, A). At this point, the path of the least resistance seems to be higher and that confirms our Bullish stance on the US Stock market.


