Markets have bearish momentum. For a couple of weeks now, stocks and stock indexes are almost every day in red.
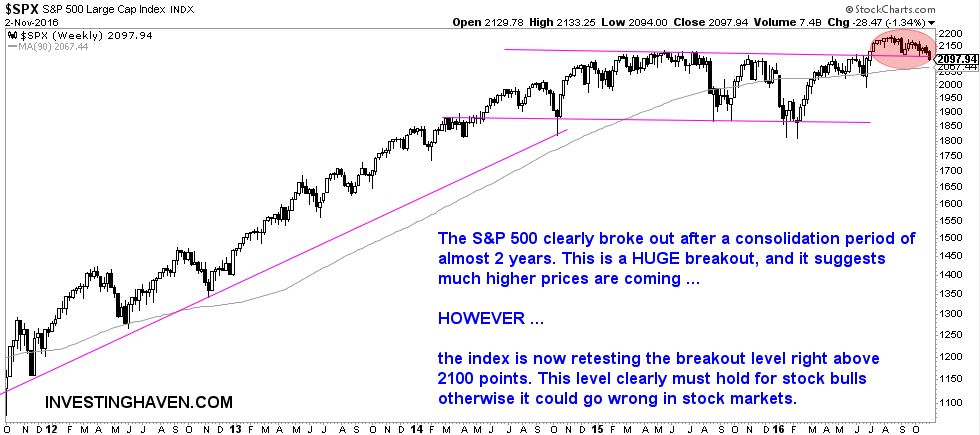
The key question in such type of environment is at which point things are really becoming a concern. The answer to that question is, as always, primarily visible on the charts. As the belwether of stock markets, we look at the weekly S&P 500 index below.
As clearly seen, and annotated with the light red circle, the index is testing its breakout level of July of this year. The million dollar question is whether previous resistance will become support or whether we have witnessed a false breakout. The first scenario would be strongly bullish, the latter strongly bearish. Life is definitely not easy for investors.
We need a bit of time to identify how exactly the index will behave at this price level. The U.S. election is certainly creating uncertaintly, but, whatever the reason, the fact of the matter is that critical levels are being tested.
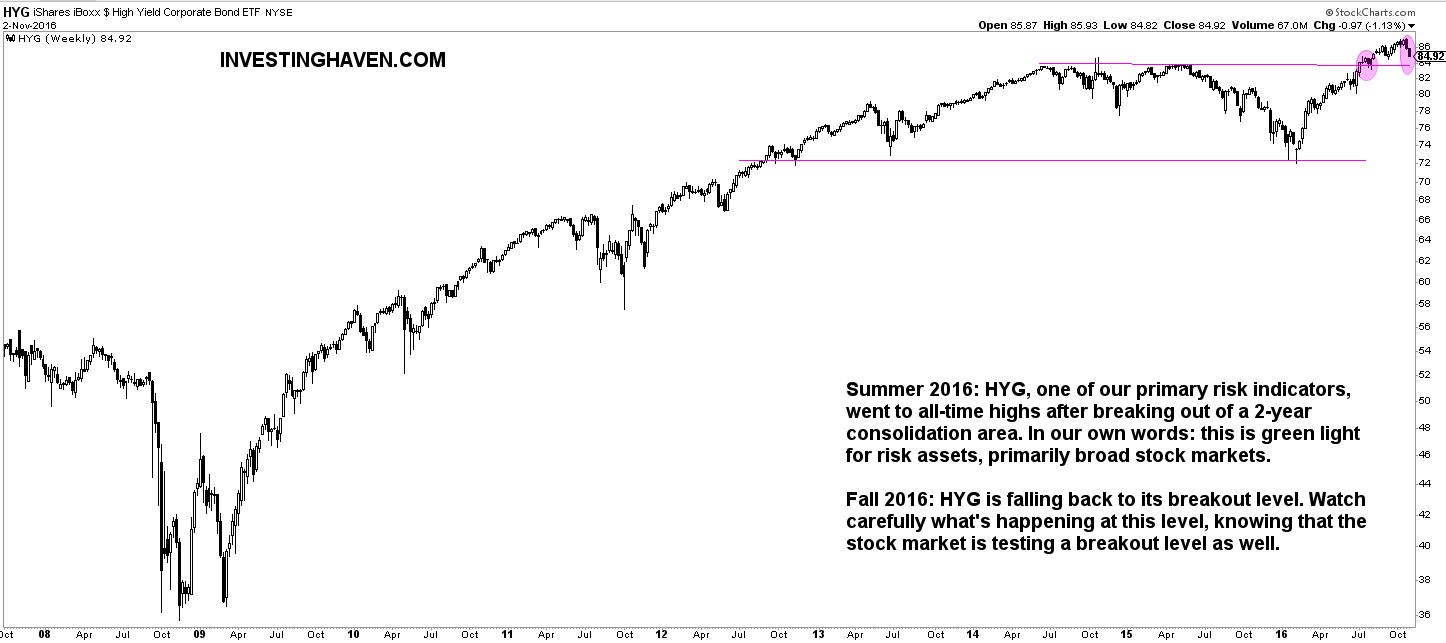
If anything, one of our key risk indicators, the HYG, is still in a long term uptrend although it is also testing support. It has a similar view as the S&P 500 itself. So at this point, the HYG is not providing any guidance.
Copper is another leading indicator according to our methodology. A bullish copper price tends to suggest that economic conditions are improving. As explained earlier today in Copper chart looks special, copper could become very bullish in the short run, though there is no confirmation of that scenario yet.
So investors find themselves in a situation where stock indexes as well as leading indicators are all simultaneously testing critical support levels. A little bit of time is needed for markets to reveal the direction they want to choose. This is not the time to panick (yet), but to be extremely vigilant.


