Investing Haven
No Result
View All Result
Gold Silver Investing >>
CRYPTO INVESTING >>
  • 2025 Forecasts
    • 10 market predictions
    • Dow Jones forecast
    • S&P 500 forecast 2025
    • Nasdaq prediction 2025
    • Best altcoins to buy
    • Best crypto to buy now
    • Which crypto will explode
    • 15 crypto forecasts 2025
    • Which precious metal to buy
  • Silver
    • Silver prediction 2025 – 2030
    • Will silver exceed $30?
    • When will silver hit $50?
    • Can silver hit $100?
    • Silver shortage
    • 50-year silver chart
    • Silver bullish reversal
    • Silver seasonality charts
    • How to invest in silver
  • Gold
    • Gold prediction 2025 – 2030
    • Will gold set new ATH?
    • Will gold hit $3,000?
    • Can gold hit $10,000?
    • Gold chart 10 years
    • Gold chart 50 years
    • Gold chart 100 years
    • Gold silver ratio
    • Gold seasonality charts
  • Commodities
    • Coffee forecasts
    • Sugar forecasts
    • Nickel forecasts
    • Lithium investing
  • Crypto forecasts
    • BTC prediction 2025 – 2030
    • ETH prediction 2025 – 2030
    • SOL prediction 2025 – 2030
    • XRP prediction 2025 – 2030
    • XLM prediction 2025 – 2030
    • BNB prediction 2025 – 2030
    • ADA prediction 2025 – 2030
    • AVAX prediction 2025 – 2030
    • KAS prediction 2025 – 2030
    • NEAR prediction 2025 – 2030
    • BCH prediction 2025 – 2030
    • LINK prediction 2025 – 2030
    • DOT prediction 2025 – 2030
    • SUI prediction 2025 – 2030
    • ICP prediction 2025 – 2030
    • LTC prediction 2025 – 2026
    • STX prediction 2025 – 2030
    • DOGE prediction 2025 – 2030
    • SHIB prediction 2025 – 2030
    • PEPE prediction 2025 – 2030
    • FLOKI prediction 2025 – 2030
    • WIF prediction 2025 – 2030
    • ONDO prediction 2025 – 2030
  • News
    • Crypto news
    • Commodities
  • Login
Investing Haven
No Result
View All Result

Home » Reading markets » Did A New ‘Risk Off’ Cycle Start? Stock Markets About To Decline Sharply?

Did A New ‘Risk Off’ Cycle Start? Stock Markets About To Decline Sharply?

Taki T. by Taki T.
April 8, 2018
in Reading markets
disruption markets
2k
VIEWS
Share on FacebookShare on Twitter

Not only are stock markets volatile since January of this year, also is the fear for a  Stock Market Crash In 2018 rising. Is this legitimate or not?

In this alert Stock Market Crash 2018 About To Start published 2 months ago we concluded the following:

This is intermarket dynamics, this is how many flows across markets, this is where smart investors which are ahead of the game show traces of what they are doing. And that’s what we are following. Long story short: the Yen is not revealing any preliminary sign a stock market crash in 2018.

Essentially, we looked at the Yen chart looking for leading indicator signals. We did not observe any concerning sign in there.

Theoretically, there are 3 other assets which can benefit from ‘risk off’ cycles. In monetary terms, once smart and large investors get concerned, they send their capital to ‘risk off’ assets suggesting that a new ‘risk off’ cycle has started.

The 3 assets we are talking about are (other than the Yen): the volatility index, high beta stocks, interest rates.

Note: we, of course, are not talking about the alternating risk on / risk off that mainstream media references every other day, as for instance in this Bloomberg article. We are looking for secular trends in which investors hold positions for 12 to 18 months which is how the vast majority of profits are made. That’s the only thing we are interested in.

3 more ‘risk off’ assets reviewed

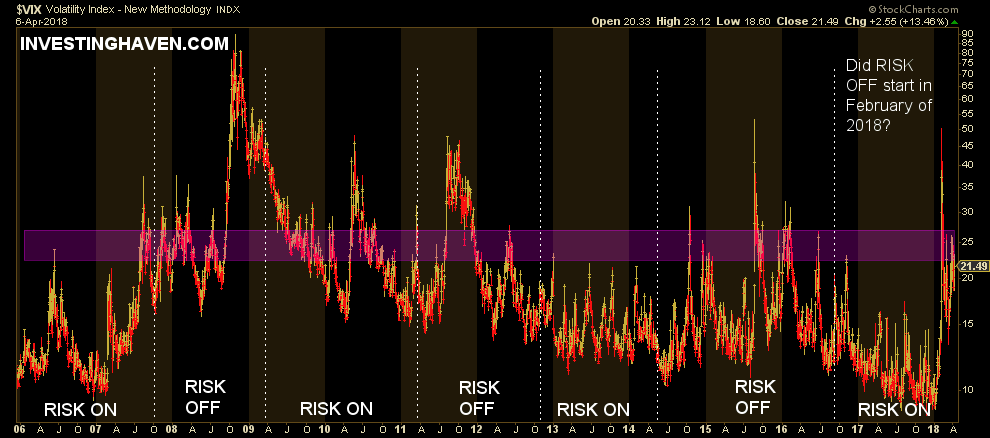
The volatility index chart below, the VIX, is overlayed by the risk on / risk off cycles in stock markets. As clearly seen, the 22 to 27 area provides heavey resistance. Only occassionaly has the VIX gone higher, and it has primarily done so during ‘risk off’ cycles.

What can we derive from the VIX shooting up to 50 a few weeks back? Not a lot at this point in time. There have been instance in the past in which the VIX reached similar levels even in ‘risk on’ cycles.

For now, we cannot really leverage the VIX as a leading indicator to understand whether stock markets turned bearish in February of this year.

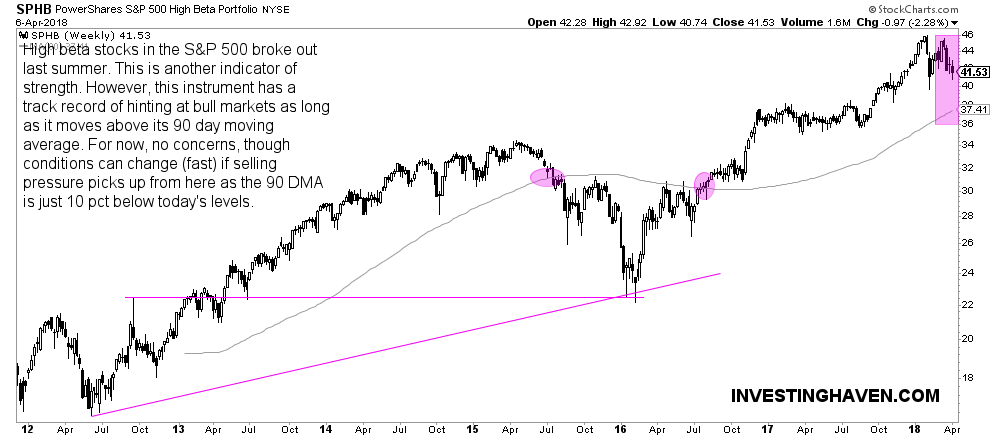
High beta stocks (represented by SPHB ETF) are typically the ones that benefit most from risk on cycles. Over the course of the last 6 years which is essentially for how long the SPHB exists. The major finding on this chart is that risk off cycles are characterized by the SPHB falling below its 90 day moving average (90 DMA) which is the only technical indicator we include in our methodology.

Needless to say, any moving average is historical in nature, so cannot act as a leading indicator. It is useful to track it along with other indicators but it is not able to forecast way ahead in time.

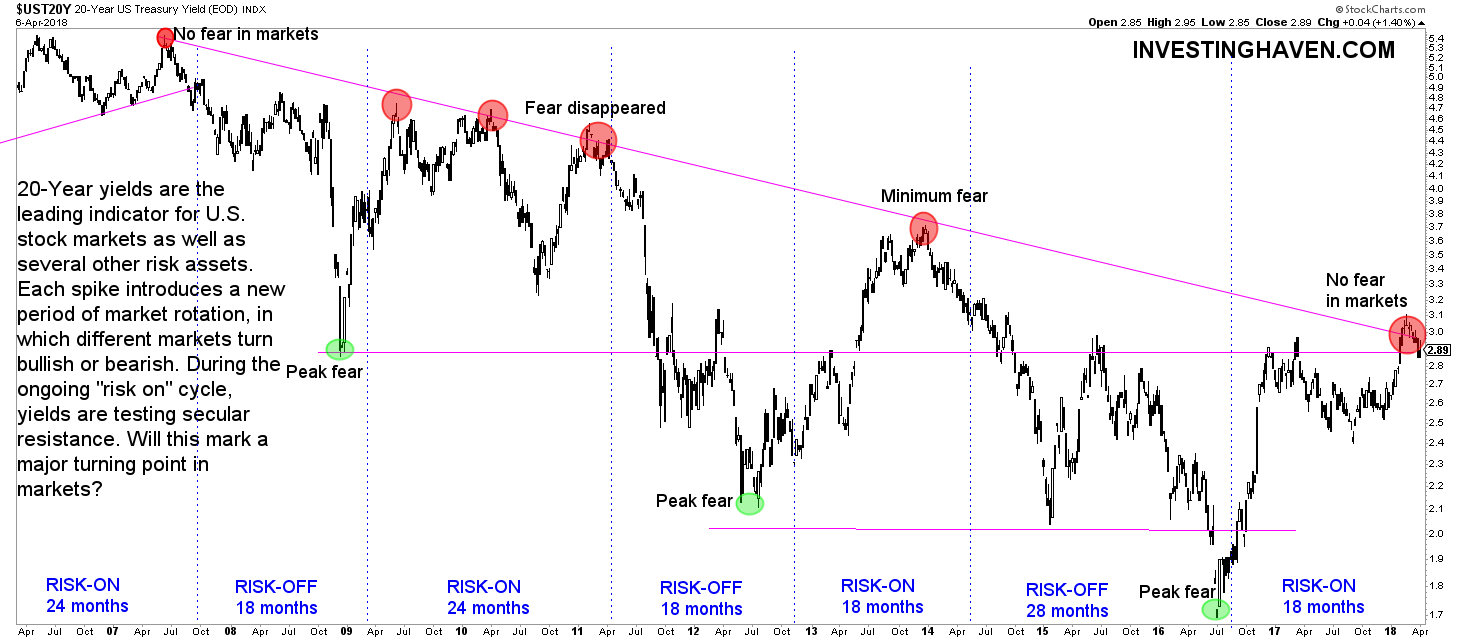
This leaves us with the only, and strongest, leading indicator we rely on: interest rates. The 20-year Treasury Yields are included below, long term weekly chart, with lots of annotations.

As seen, the risk off cycles are signaled way ahead in time by peaking interest rates (red circles).

Right now, we may be in a situation in which interest rates have peaked, and, consequently, would send stock markets lower. The only exception would be a situation similar to 2010 in which interest rates only fall temporarily only to come back to their secular resistance line.

Why do we believe that this time may be different? Because there are signs of rising rates, one of them being an inverted head-and-shoulder formation on this chart which is not visible to most of you. The 2012 period is the left shoulder, the 2015 period is the head, and 2017 the right shoulder, all inverted. This may signal the end of falling rates, in which case rates would only fall temporarily.

Our thesis is that if 20-year rates do not go significantly lower form here, we will see softly rising rates, and rising stock markets. In this scenario we expect stock markets to rise until a certain point in 20-year rates is achieved. We will not communicate the level we have in mind until we have sufficient confirmation that our thinking is accurate.

Note that we signaled this situation more than one year ago in Disruption Ahead In Stock And Bond Markets?

In sum, we are at an important decision point in markets.

10-YEAR ANNIVERSARY OFFER: InvestingHaven.com celebrates 10 years. Temporarily, you can enjoy a discount on our premium gold/silver and crypto reports. Or you can become a VIP member. Go to our anniversary deals >>
Receive our weekly newsletter.

premium service SP-500 premium service trade alerts premium service crypto teaser 

No related posts.

Tags: SPHBXJYYEN
Taki T.

Taki T.

Taki is a chart analyst who is passionate about unlocking unique insights out the chart. While the vast majority of analysts remain focused on price analysis, Taki starts with timeline analysis and adds price analysis to this. In doing so, he developed a unique methodology to find opportunities in financial markets, across assets and markets.

Leave a Reply Cancel reply

Your email address will not be published. Required fields are marked *

Connect with InvestingHaven

Receive top notch forecasts for free.

*We hate spam as you do.

Site Navigation

  • RSS Feed
  • About us
  • Advertising
  • Sponsored Content Policy
  • Mission 2026
  • Sitemap
  • Privacy & Disclaimer
  • Terms of Service
  • Contact Us
investing haven logo

Precious metals market analysis including gold and silver price predictions. Crypto market analysis including highly accurate BTC ETH SOL XRP forecasts.

Copyright © 2025 InvestingHaven

Login to your account below

Forgotten Password?

Fill the forms bellow to register

All fields are required. Log In

Retrieve your password

Please enter your username or email address to reset your password.

Log In

Receive top notch forecasts for free.

*We hate spam as you do.

No Result
View All Result
  • News
  • 2025 Forecasts
    • 10 market predictions
    • Dow Jones forecast 2025
    • S&P 500 forecast 2025
    • Nasdaq prediction 2025
    • Best crypto to buy now
    • Which crypto will explode
    • Best altcoins to buy
    • 15 crypto forecasts 2025
    • Which precious metal to buy
  • Silver articles
    • Silver prediction 2025 – 2030
    • Will silver exceed $30?
    • When will silver hit $50?
    • Can silver hit $100?
    • Silver shortage
    • 50-year silver chart
    • Silver bullish reversal
    • Silver seasonality charts
    • How to invest in silver
  • Gold
    • Gold prediction 2025 – 2030
    • Will gold set new ATH?
    • Will gold hit $3,000?
    • Can gold hit $10,000?
    • Gold chart 10 years
    • Gold chart 50 years
    • Gold chart 100 years
    • Gold silver ratio
    • Gold seasonality charts
  • Commodities
    • Sugar forecasts
    • Coffee forecasts
    • Nickel forecasts
    • Lithium investing
  • Crypto news
  • Crypto forecasts
    • BTC prediction 2025 – 2030
    • ETH prediction 2025 – 2030
    • SOL prediction 2025 – 2030
    • XRP prediction 2025 – 2030
    • XLM prediction 2025 – 2030
    • BNB prediction 2025 – 2030
    • ADA prediction 2025 – 2030
    • AVAX prediction 2025 – 2030
    • KAS prediction 2025 – 2030
    • NEAR prediction 2025 – 2030
    • BCH prediction 2025 – 2030
    • LINK prediction 2025 – 2030
    • DOT prediction 2025 – 2030
    • SUI prediction 2025 – 2030
    • ICP prediction 2025 – 2030
    • LTC prediction 2025 – 2026
    • STX prediction 2025 – 2030
    • DOGE prediction 2025 – 2030
    • SHIB prediction 2025 – 2030
    • PEPE prediction 2025 – 2030
    • FLOKI prediction 2025 – 2030
    • WIF prediction 2025 – 2030
    • ONDO prediction 2025 – 2030
  • Premium Crypto Alerts
  • Premium services

Copyright © 2025 InvestingHaven