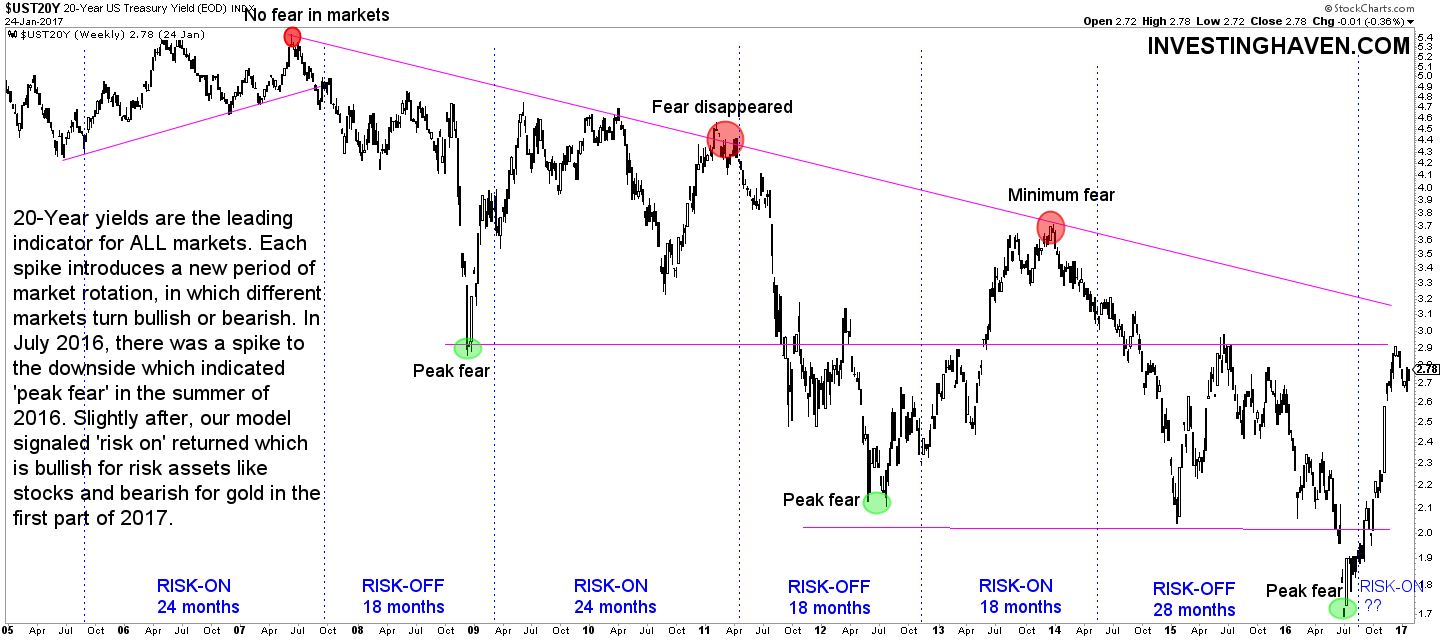
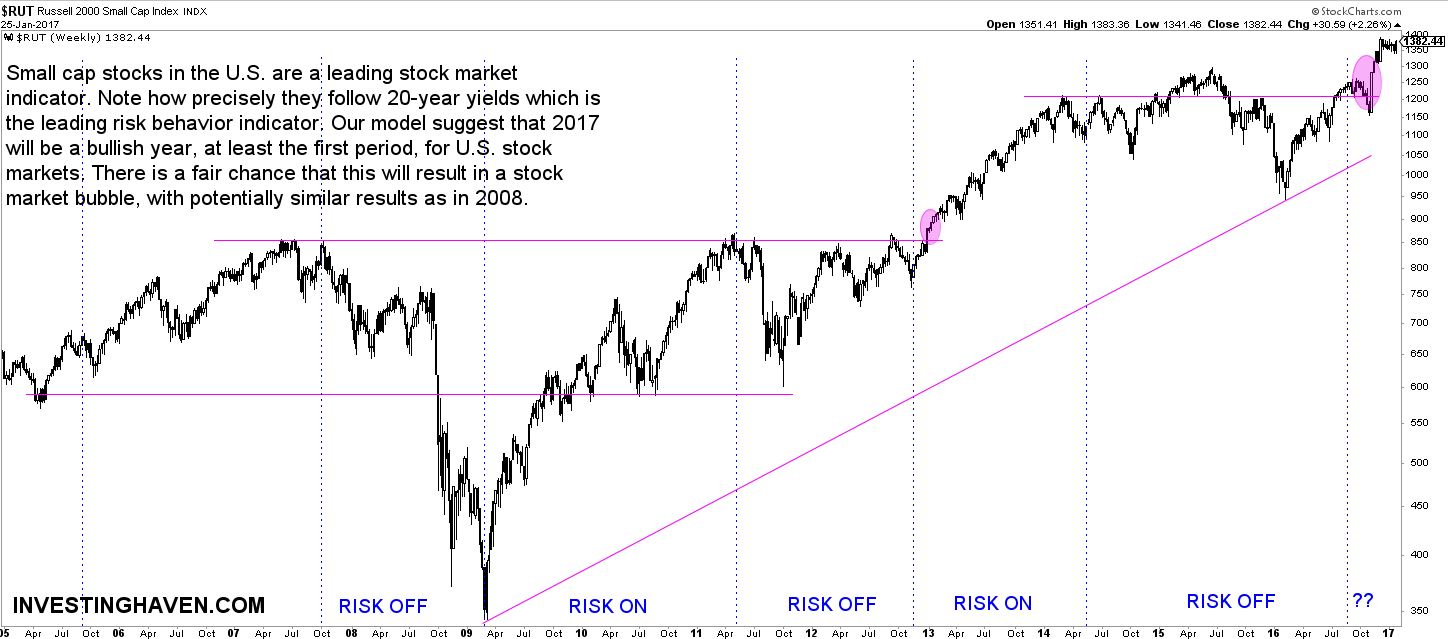
Investors remain in a ‘risk on’ mood. InvestingHaven’s research team identified this as a normal market cycle, as explained in Market Outlook 2017 According To Our Proprietary Indicators. ‘Risk on’ and ‘risk off’ are normal market cycles, and the current cycle started last summer.
‘Risk on’ is determined based on the 10-year Treasury Yield as the most outspoken risk indicator. As shown on the chart, every time an important cycle top or peak is reached, it signals a change in risk sentiment.
The 10-year Treasury Yield is an ideal indicator for stock markets. Other than that, the ‘risk on’ trade tells something about commodities though the commodity is much more complex than that. At this very moment, in line with InvestingHaven’s prior calls, some specific commodity markets are doing well, but not all of them.
Stock markets clearly follow the ‘risk on’ and ‘risk off’ pattern. The crucial unknown is the time of how long such a cycle lasts, very hard to know for sure, which is why the position and signal of all leading markets should be considered. For instance, the chart pattern of bonds, stocks, gold and important currencies all together should be taken into account, according to InvestingHaven’s research team.
The stock market chart, represented by Russell 2000, most sensitive to risk, is now visibly in ‘risk on’ mode.
When it comes to commodities, right now copper is outperforming, as well as agricultural commodities and uranium. These are typical risk sensitive assets so no surprise they move higher in this ‘risk on’ market cycle. However, the opposite is not necessarily true, given that all 3 commodity types have been in a 5-year bear market (since 2011).


