Most stock indices lost between 10 and 15 pct in recent weeks. That is significant enough to wonder whether a stock market crash is in the making. Needless to say, the 2009 crash is a stigma in the psyche of the majority of investors. Media has been fast to call the ongoing retracement the stock market crash of 2018, which is not helpful to investors looking for guidance as we have not discovered any meaningful theory or method underpinning those articles. This suggested that InvestingHaven’s research team had to look into the question, and report back to its readers. This article gives an answer to the question whether the stock market crash 2018 has started or not.
Before looking deep into our central question we want to highlight that this is not a moment to get emotional. Financial media like CNBC, Bloomberg, Yahoo! Finance, continue to publish fearful articles. On the one hand, rightfully so, as investors always should remain vigilant as markets are a high risk place to be. On the other hand, though, it is mandatory to be factual, and only take decisions based on a well thought through method that has stood the test of time.
That’s what InvestingHaven’s research team is doing for you. We work on a method that answers key questions for investors.
The stock market crash that we predicted as a flash crash
Last year we predicted a flash crash to take place early 2018. This is what we wrote 3 months ago:
Let’s put the current stock bull market in historical context. As the charts speak for themselves we believe they suggest a stock market crash is brewing, and it could start as early as the first days or weeks of 2018.
We went on towards the end of last year to forecast that it would be more of a flash crash alike correction: sharp and fast, somehow simlar to the 1987 stock market crash.
One thing we are closely monitoring, and we do not have a final answer yet, is whether U.S. stocks will crash in 2018. As per our forecast 2 months ago we believe there will be at least a flash crash similar to October 1987. However, it is not set in stone, markets can behave different than how we expect they will, so we always keep an open mind towards our own forecasts, and readers must do the same.
How much more spot-on could we have been?
Full disclosure, though, this projection for the stock market crash 2018 came after we were wrong about a shorter term prediction. Last summer we predicted a stock market crash by November, see here. What we learn from that mistake is that we will never do a short term forecast again, ever, in our life. Short term forecasting is way too hard, our method is not designed for a 1 or 2 month forecasts. Our method works wonderfully well for 3 to 18 month cycles, so we will stick to that timeframe going forward.
The trillion dollar question on the mind of investors is whether this is the start of the stock market crash 2018 or whether this was it.
We did not investigate that question when we did our projection a couple of months ago. We do have an answer now though.
Stock market crash 2018 – a leading indicator
In general terms, it is not accurate to talk about a stock market crash if a 10 to 15 percent correction takes place. So even our forecast of the ongoing flash crash was accurate we are far away from real crash levels.
Back to the central question: is a stock market crash 2018 unfolding now?
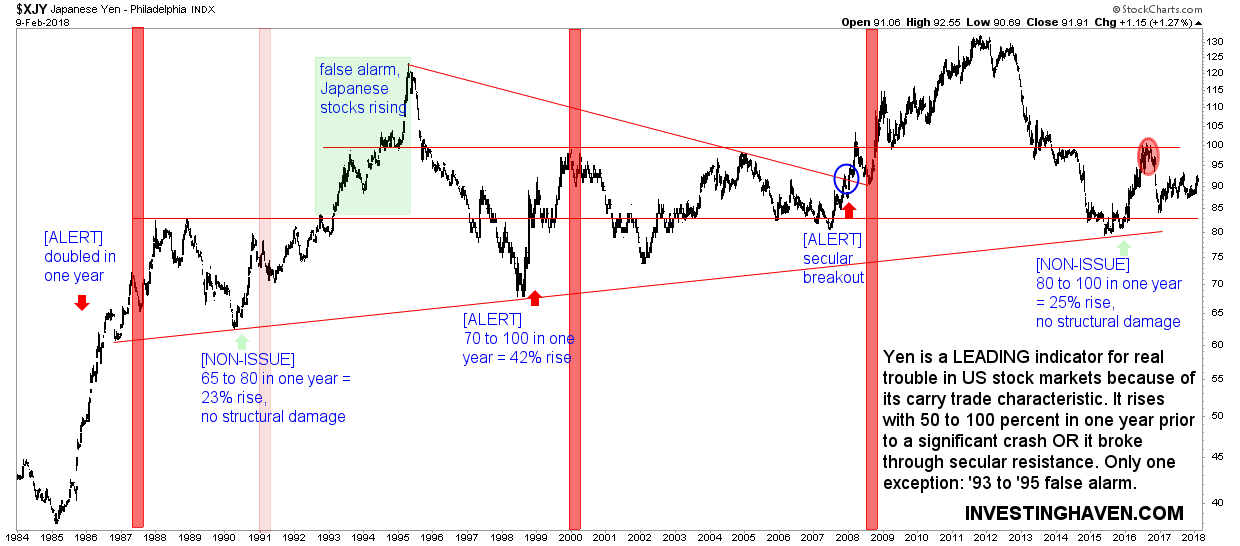
The research team of InvestingHaven does not think so. Although the researchers spent a lot of time solving this question, and have collected many charts to make this point, there is only a handful of charts that stand out. The one below is one of the key charts we have identified.
The chart in this chart is the Japanese Yen monthly chart on 40 years. Why are we using a Japanese currency to forecast anything about U.S. and global stock markets?
The answer is simple: it has proven to be a leading indicator. The underlying reason is the carry trade characteristic of the Yen.
That’s not a strange idea because if the smart money gets out of stocks, it has to go somewhere, right?
The Yen has correctly forecasted major stock market crashes in the last 4 decades when it did one of the two things. Either, it had been rising between 50 and 100 pct in one year prior to a mega crash (1987, 2000) and/or it broke secular resistance (2008).
The opposite is true as well: the 1991 and 2016 corrections which were in the bigger scheme of things not meaningful did not result in any meaningful secular damage on the Yen chart, nor did the Yen rise that sharply.
This is intermarket dynamics, this is how many flows across markets, this is where smart investors which are ahead of the game show traces of what they are doing. And that’s what we are following.
Long story short: the Yen is not revealing any preliminary sign a stock market crash in 2018.


