Investors are constantly on the outlook for leading indicators. Such a leading indicator carries a predictive value for other markets. One well known leading indicator is the U.S. dollar: as the dollar rises it is expected to put pressure on commodity prices and gold. Our viewpoint is that this is not a perfect correlation, it works most of the time but certainly not always so it is not very reliable as a leading indicator. Gold is known to be an inflationary asset, so one could rightfully ask whether the TIPS Bond (representing inflation expectations) is a leading indicator for the price of gold.
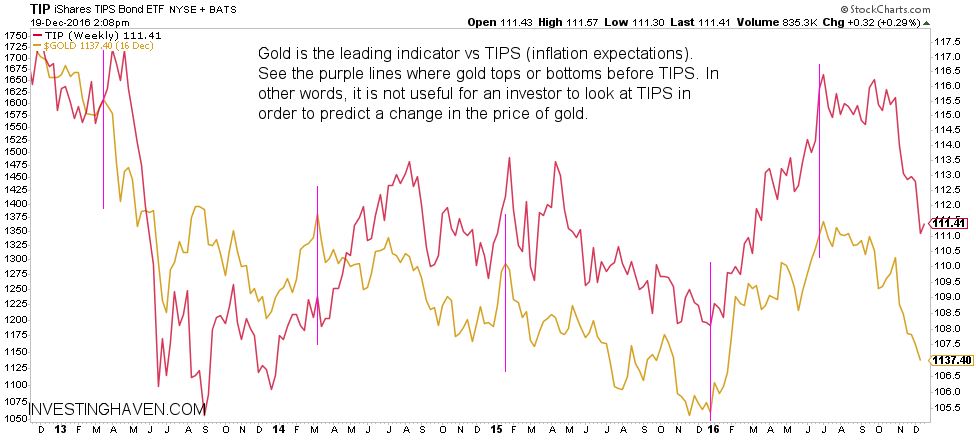
We looked into this question by plotting both the price of gold and TIPS Bonds on one chart. Below is a weekly chart on a 4-year timeframe.
At first glance, both assets have a very similar trend. They clearly move in an identical way on a longer term horizon.
The key question is whether, on a micro level, there is a consistent behavior in one of the two assets leading a decline or rally. As it is not very easy to capture all details of the chart, we indicated with purple (vertical) lines some important pivot points. Those are mostly points where gold reached a medium term top or bottom.
As seen quite consistently, gold is almost in all instances the asset that first moves higher or lower. In 3 of the 5 instances there was a dramatic move in gold which was followed by the TIPS Bonds only several weeks later. In 2 of the 5 instances they moved higher or lower almost simultaneously.
So our conclusion is that TIPS Bonds are not a leading indicator for the gold price. It is gold that is leading TIPS Bonds higher of lower, sometimes with a time delay.
This is an important insight for gold investors, and for analysts looking for market correlations.


