The transportation index is one of those stock market segments which play a strategic role. Are they flashing a signal of a major peak in stock markets which will potentially result in a stock market crash in 2018 or is this the start of a parabolic rise which will result in hyperinflation?
If transports and the Dow Jones index are rising simultaneously it suggests a strong stock bull market is ongoing. The opposite is true as well.
If transports and the Dow Jones index are diverging, which only happened 3 times in the last 2 decades there is something fundamentally wrong, and turmoil in markets will follow. The 3 instances in which this happened since 1998 is right before the dotcom crash, right before the financial crisis (2008) and during the major oil crash in 2015.
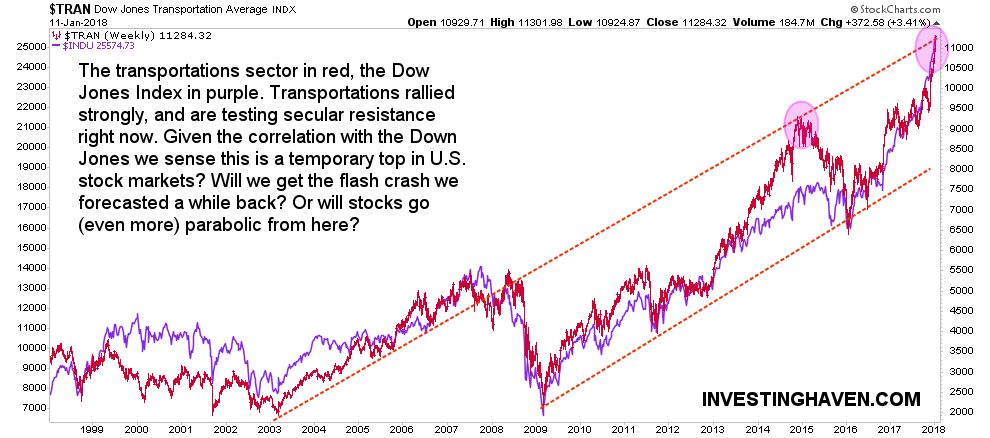
Right now the transportation index TRAN is hitting all-time highs. Moreover, it is rising simultaneously with the Dow Jones index which suggests strength in U.S. stock markets.
What’s more, it is touching the top of a very long term rising channel as seen on below chart.
Wait, if this is a test of the top of the bull channel then it could be a red flag. Is it? Or will transports break out, and start rising in a parabolic fashion which could suggest a stock market bubble or even hyperinflation?
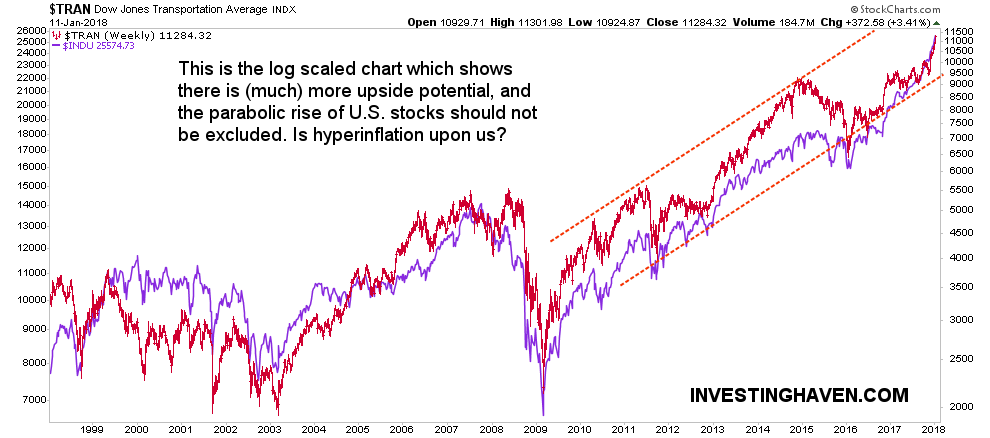
Here it becomes interesting. Because the above chart is not the ‘right’ way to look at this market. The chart is not log scaled so it’s not the ‘right’ way to look at it.
Below is the log scaled version of the chart. It paints a different picture. It suggests that transports are not peaking right now, there seems to be more upside potential. Similar to the 2013-2015 time period a very strong leg up is being set.
This chart suggests a strong bull market rather than a market crash. Our stock market forecast from last summer was totally incorrect, and it could be that our flash crash will be proven wrong as well. We keep an open eye to any outcome, and adjust our insights as we go.


