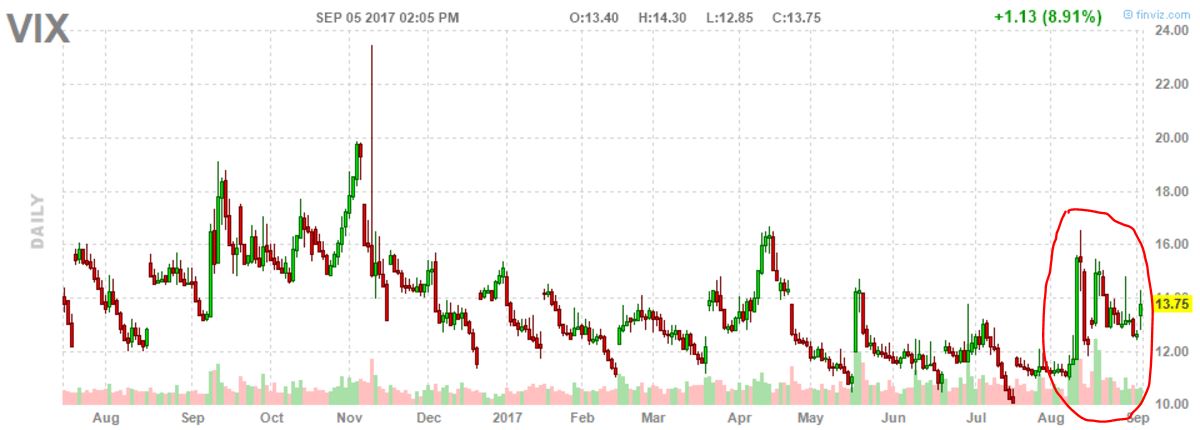
Stock markets are in red today driven by U.S. markets. That should not come as a surprise as InvestingHaven warned readers back in April that volatility would start rising around summer time. According to InvestinHaven’s proprietaty market barometer there would be serious volatility as of summer 2017.
The S&P 500 was down more than 1% around noon while the Nasdaq bottomed at 1.6% at the same time.
Uncoincidentally, the last week of July marked a historic low in volatility. In other words, stock market investors reached a level of maximum complacency, and we said it was clearly bearish. InvestingHaven’s research team continued analyzing leading indicators, and came to this ‘shocking’ conclusion: Ignore This Series Of Volatility Warning Signs At Your Own Peril.
The result was a bearish S&P 500 Forecast For October 2017, suggesting the leading U.S. stock market index was pointing to a correction towards 2125 points.
Today, we see another spike in volatility. Since the second week of August, volatility is on the rise, see red circle annotated on the chart. So far, the 4 spikes in 3 weeks had a lower high, but we are really concerned that it is a matter of time until we see a higher higher. This pattern is a pressure cooker, without any doubt.
Let’s not forget: money managers, hedge fund managers and other investment managers are back from holiday. Typically, Labor Day marks the end of a quiet period. As of Labor Day trading volume increases significantly to “normal” levels. That is the reason why any new trend always moves “hard” starting early September. This year should be no exception.
What’s next for stocks?
As stock markets (in the U.S.) correct during their seasonally weak period (September / October) we are convinced that capital will be flowing out of U.S. stocks into emerging stock markets. That is a natural rotation which we discussed many times in the last 12 months:
- Big News: Emerging Markets Inches Away From New Secular Bull Market (May 2017)
- Emerging Markets Will Be Strongly Bullish In 2018 (April 2017)
- Will Emerging Markets Become The Investment Of 2016 And 2017? (April 2016)
This is a quote from one of the articles we wrote many months ago:
The emerging markets chart shows that emerging markets have created an unusually long consolidation period of 9 years. From a price analysis point of view this is very, very significant. Smart investors will notice the breakout, and they will accumulate significant levels of investments, which will drive prices higher, and create momentum longer term.
U.S. stocks have risen too high, and it is time for a healthy correction. Emerging markets on the other hand have consolidated for 9 years. It is a simple law of nature that capital will flow out of U.S. stocks during the coming correction, and flow into emerging markets as the correction runs to an end.


