Investing Haven
No Result
View All Result
Gold Silver Investing >>
CRYPTO INVESTING >>
  • 2026 Forecasts
    • 10 market predictions
    • Dow Jones forecast
    • S&P 500 forecast 2026
    • Nasdaq prediction 2026
    • Best altcoins to buy in 2026
    • Best crypto to buy now
    • Which crypto will explode
    • 15 crypto forecasts 2026
    • Which precious metal to buy
  • Silver
    • Silver prediction 2026 – 2031
    • Can silver hit $100?
    • Silver shortage
    • 50-year silver chart
    • Silver bullish reversal
    • Silver seasonality charts
    • How to invest in silver
  • Gold
    • Gold prediction 2026 – 2031
    • Will gold set new ATH?
    • Can gold hit $10,000?
    • Gold chart 10 years
    • Gold chart 50 years
    • Gold chart 100 years
    • Gold silver ratio
    • Gold seasonality charts
  • Commodities
    • Coffee forecasts
    • Sugar forecasts
    • Nickel forecasts
    • Lithium investing
  • Crypto forecasts
    • BTC prediction 2026 – 2031
    • ETH prediction 2026 – 2031
    • SOL prediction 2026 – 2031
    • XRP prediction 2026 – 2031
    • XLM prediction 2026 – 2031
    • BNB prediction 2026 – 2031
    • ADA prediction 2026 – 2031
    • AVAX prediction 2026 – 2031
    • KAS prediction 2026 – 2031
    • NEAR prediction 2026 – 2031
    • BCH prediction 2026 – 2031
    • LINK prediction 2026 – 2031
    • DOT prediction 2026 – 2031
    • SUI prediction 2026 – 2031
    • ICP prediction 2026 – 2031
    • LTC prediction 2026 – 2031
    • STX prediction 2026 – 2031
    • DOGE prediction 2026 – 2031
    • SHIB prediction 2026 – 2031
    • PEPE prediction 2026 – 2031
    • FLOKI prediction 2026 – 2031
    • WIF prediction 2026 – 2031
    • ONDO prediction 2026 – 2031
  • News
    • Crypto news
      • Bitcoin
      • Ethereum
      • XRP
      • Solana
      • Dogecoin
      • Cardano
      • Litecoin
    • Commodities
      • Gold
      • Silver
    • Markets & Stocks
    • Press Releases
  • Reviews
  • Login
Investing Haven
No Result
View All Result

Home » Trendwatching » Emerging Markets Weak: Buy Or Sell In 2018?

Emerging Markets Weak: Buy Or Sell In 2018?

Taki T. by Taki T.
February 1, 2019
in Trendwatching
[:en]emerging stock markets[:nl]groeimarkten[:]
Share on FacebookShare on Twitter

Emerging markets (EEM) peaked in January of 2018, and have been quite weak since then. The million dollar question is whether emerging markets are a buy or a sell for the second half of 2018?

First, before looking into this, question, let’s consider our previous viewpoints.

Early 2018, we considered that Emerging Markets Would Outperform US Markets. That is partly materialized, at least so far, as, in recent months, US broad markets showed a divergence: large cap stocks in the Dow Jones index are trading slightly lower than early this year, while small cap stocks in the Russell 2000 index are visibly higher. Emerging markets are lower than early this year.

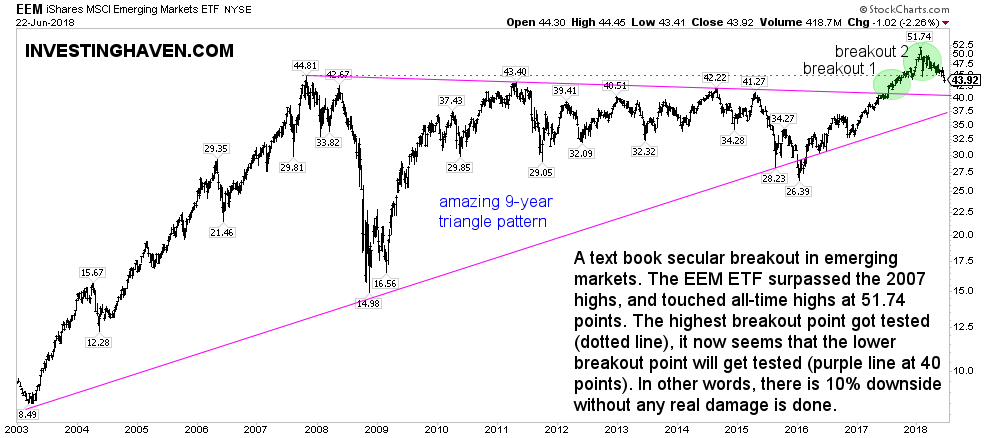
We continued to believe that Emerging Markets were Bullish, and wrote about it in detail a couple of weeks ago, because of 2 reasons. First, from a fundamental perspective, emerging markets valuations are cheap. It is clear that emerging markets have underperformed for many years. That is great from the perspective that, the longer the underperformance lasts, the more profitable the opportunity. Second, emerging markets broke out to new highs, surpassing their 2007 peak.

Moreover, we also found a strong correlation with commodities, as explained in Emerging Markets And Commodities Very Bullish In 2018 and 2019. Both are still correlated, as, in recent weeks, both have been rather weak.

Given all this, what is still accurate, and what do we read in the charts?

Emerging markets: close to a buy opportunity in 2018

Let’s focus on the chart first. InvestingHaven’s method is based on the principle summarized as ‘start with the chart‘.

The point about reading charts is to find the right timeframe which reveals a clear and outspoken pattern which suggests a future direction. No compromise on this principle. There is no sense in trying to imagine a pattern, by almost faking it, if it’s not there.

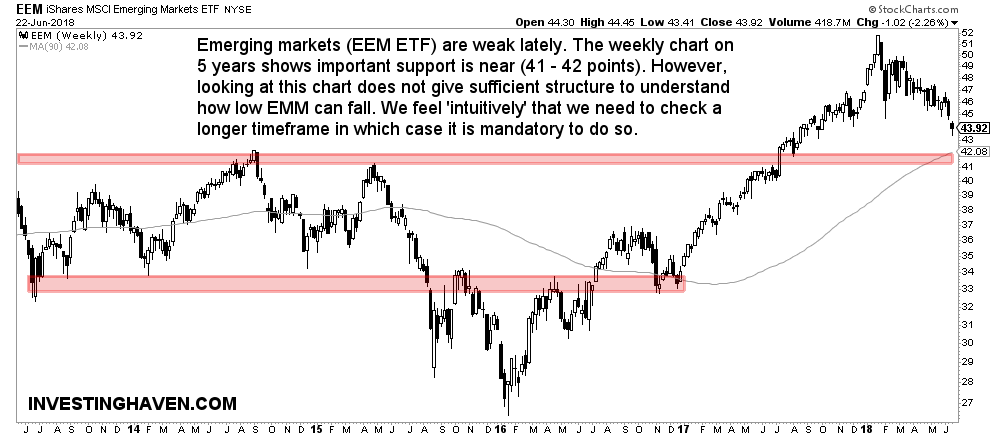
The weekly emerging markets chart on 5 years has some nice insights, first and foremost a longer term support zone in the 41 – 42 points area. However, there is visibly not sufficient info on this chart. What does this chart reveal in terms of longer term trends and forces at play? Intuitively, the answer is that not enough can be deducted from this chart.

emerging markets 2018

That’s why we have to zoom out, and look at the longer term timeframe. The 15-year timeframe shows a very clear trend, not possible to make it any clearer. This massive triangle pattern has a ‘pixel perfect’ setup, almost to the penny (with one exception which is the false breakdown shown in the first month of 2016). It implies this pattern is reliable in forecasting future price direction.

This long term chart shows two major breakout lines: the one at 44.81 points (the 2007 peak) as well as the trendline connecting all major peaks since 2007. The latter comes in at 40 points.

We highly suspect that the 40 points area of the emerging markets ETF EEM might be tested in the coming weeks and month(s). That is a 10 pct downside compared to current price levels.

We feel quite confident, given all data points outlined in this article, that there is maximum 10 pct downside in emerging markets. It implies that emerging markets might be very close to a very attractive entry point, so we likely flash another buy opportunity anytime soon!

emerging markets buy 2018

10-YEAR ANNIVERSARY OFFER: InvestingHaven.com celebrates 10 years. Temporarily, you can enjoy a discount on our premium gold/silver and crypto reports. Or you can become a VIP member. Go to our anniversary deals >>
Receive our weekly newsletter.

premium service SP-500 premium service trade alerts premium service crypto teaser 

No related posts.

Tags: Emerging Markets EEM ETF
Taki T.

Taki T.

Taki is a chart analyst who is passionate about unlocking unique insights out the chart. While the vast majority of analysts remain focused on price analysis, Taki starts with timeline analysis and adds price analysis to this. In doing so, he developed a unique methodology to find opportunities in financial markets, across assets and markets.

Leave a Reply Cancel reply

Your email address will not be published. Required fields are marked *

Connect with InvestingHaven

Receive top notch forecasts for free.

*We hate spam as you do.

Site Navigation

  • RSS Feed
  • Advertising
    • Sponsored Content Policy
  • Advertising Disclosure
  • Risk Disclosure
  • Privacy Policy
  • Terms of Service
  • Sitemap
  • About us
  • Contact Us
investing haven logo

Precious metals market analysis including gold and silver price predictions. Crypto market analysis including highly accurate BTC ETH SOL XRP forecasts.

Copyright © 2025 InvestingHaven

Login to your account below

Forgotten Password?

Fill the forms bellow to register

All fields are required. Log In

Retrieve your password

Please enter your username or email address to reset your password.

Log In

Receive top notch forecasts for free.

*We hate spam as you do.

The views and opinions expressed in this article are solely those of the author and do not necessarily represent the official position, policies, or views of InvestingHaven or its affiliates. This content is provided for informational purposes only and does not constitute financial, investment, legal, or other professional advice. Readers are advised to conduct their own research and consult with a qualified financial advisor before making any investment decisions.

No Result
View All Result
  • 2026 Forecasts
    • 10 market predictions
    • Dow Jones forecast 2026
    • S&P 500 forecast 2026
    • Nasdaq prediction 2026
    • Best crypto to buy now
    • Which crypto will explode
    • Best altcoins to buy
    • 15 crypto forecasts 2026
    • Which precious metal to buy
  • Silver articles
    • Silver prediction 2026 – 2030
    • Can silver hit $100?
    • Silver shortage
    • 50-year silver chart
    • Silver bullish reversal
    • Silver seasonality charts
    • How to invest in silver
  • Gold
    • Gold prediction 2026 – 2031
    • Will gold set new ATH?
    • Can gold hit $10,000?
    • Gold chart 10 years
    • Gold chart 50 years
    • Gold chart 100 years
    • Gold silver ratio
    • Gold seasonality charts
  • Commodities
    • Sugar forecasts
    • Coffee forecasts
    • Nickel forecasts
    • Lithium investing
  • Crypto forecasts
    • BTC prediction 2026 – 2031
    • ETH prediction 2026 – 2031
    • SOL prediction 2026 – 2031
    • XRP prediction 2026 – 2031
    • XLM prediction 2026 – 2031
    • BNB prediction 2026 – 2031
    • ADA prediction 2026 – 2031
    • AVAX prediction 2026 – 2031
    • KAS prediction 2026 – 2031
    • NEAR prediction 2026 – 2031
    • BCH prediction 2026 – 2031
    • LINK prediction 2026 – 2031
    • DOT prediction 2026 – 2031
    • SUI prediction 2026 – 2031
    • ICP prediction 2026 – 2031
    • LTC prediction 2026 – 2031
    • STX prediction 2026 – 2031
    • DOGE prediction 2026 – 2031
    • SHIB prediction 2026 – 2031
    • PEPE prediction 2026 – 2031
    • FLOKI prediction 2026 – 2031
    • WIF prediction 2026 – 2031
    • ONDO prediction 2026 – 2031
  • News
    • Crypto news
      • Bitcoin
      • Ethereum
      • XRP
      • Solana
      • Dogecoin
      • Cardano
      • Litecoin
    • Commodities & Gold
      • Gold
      • Silver
    • Markets & Stocks
  • Premium Crypto Alerts
  • Premium services

Copyright © 2025 InvestingHaven