Crude oil had a good week. It went sharply higher from $47.10 to $50.85 this week. Is April 2017 shaping up to be bullish? If April 2017 a month to buy energy stocks for the short and/or long term?
As always, investors become bullish once they start reading positive articles in financial media. It goes without saying that media was bullish this week.
Bloomberg did not say it in exactly the same way, but the energy market and, hence, energy stocks are a screaming buy according to this analyst. Also, in another article, Bloomberg looked at crude oil inventory in order to conclude the energy market is bullish.
DailyFX was positive on crude oil and energy stocks, hence a buy.
From InvestingHaven’s perspective, there is not sufficient proof to conclude that investors should buy energy stocks or the energy market. Short term trading positions could be justified though. How to come to such a conclusion? We look at the longer term crude oil chart, long term energy stocks and the relative strength of energy stocks to the broad stock market. That is the way to avoid a common pitfall, which is to get too excited after one bullish week.
Before looking at the 3 charts, we would like to note that this post is a followup on what we wrote last month in Energy Stocks Could Collapse If This Happens. Similar charts were used last year when we explained if investors should buy energy stocks.
Are energy stocks a buy in the short term?
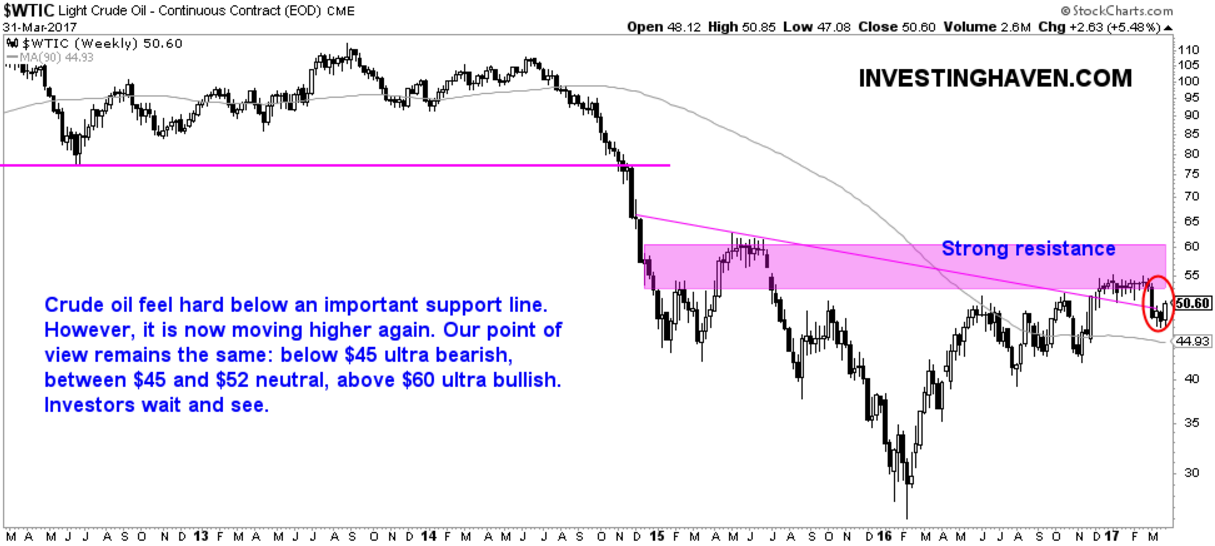
First, crude oil is in a neutral zone. The chart suggests that the $46 to $52 area is an in-between area. Below $46 crude looks ultra-bearish, below $60 it is ultra-bullish. The $52 to $60 area acts as very strong resistance.
Right now, crude oil is not bullish nor bearish. Short term, crude is likely to rally a bit.
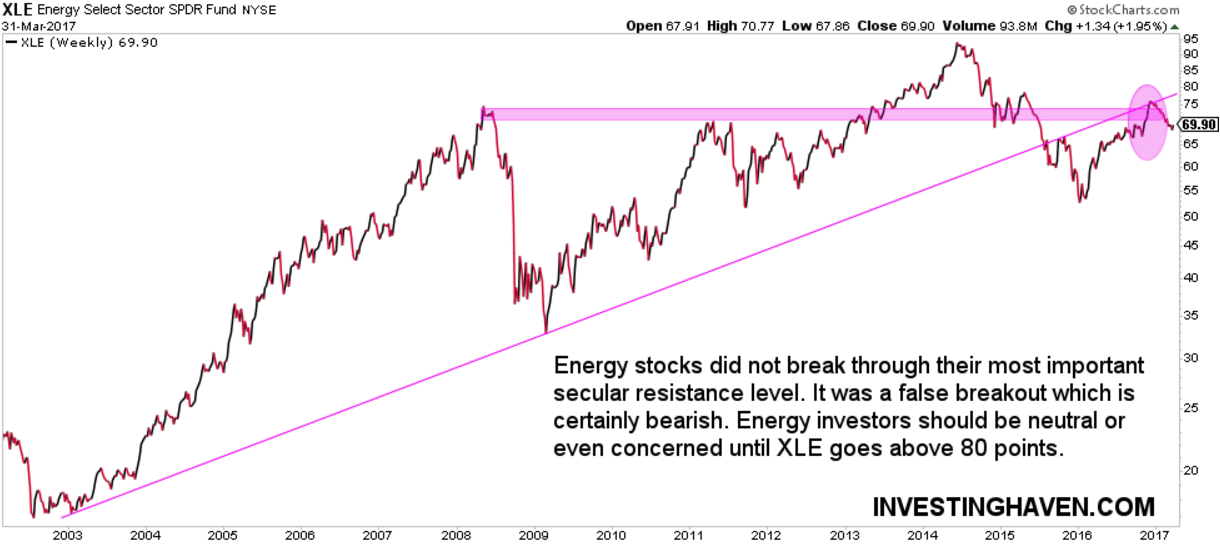
Energy stocks retraced after they hit secular resistance which is indicated with the horizontal purple line. The resistance area is meaningful as it connects the 2008 tops with the 2011 and 2016 tops. A retracement from 75 points was almost a certainty.
The most worrisome fact on this chart is that energy stocks are trading below their bull market trend line. Energy stocks are a strong buy once above 80 points. Short to medium term, they could certainly go higher, but they still remain below the trendline.
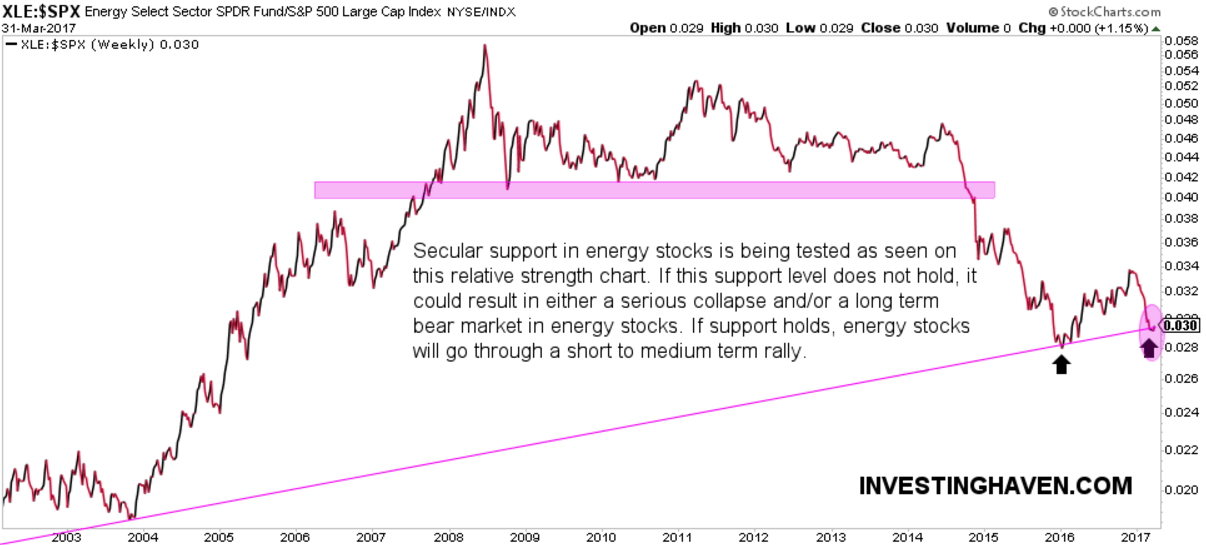
In relative terms, energy stocks are trying to bounce from secular support, as indicated with the circle. Below chart is the relative strength from energy stocks to the broad market (S&P 500), and it suggests that a strong bounce can take place from here.
All in all, we believe energy stocks and the energy market can act positively in the short term, say in April 2017, but above charts suggest that that aggressive positions are not justified. Also, long term positions should be (re)evaluated in the coming months.


