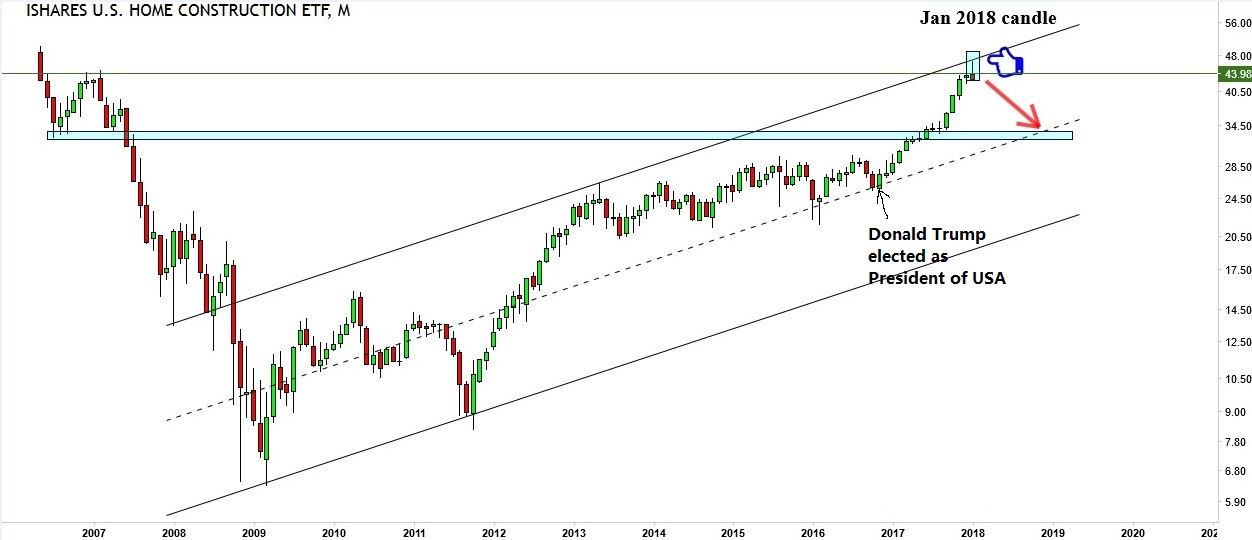
Ever since Donald Trump is elected as the President of the USA, the home construction industry has had a very flourishing 14 months since Nov 2016. That is also what the monthly chart of the ITB signals, the Home Construction sector ETF. And the entire market was very upbeat about the future, it had no protection against the downside. InvestingHaven research team’s philosophy is to focus on the big picture using the monthly candlestick chart as a guide for future market direction.
Monthly chart of ITB
Chart-wise, by the end of 31 Jan, a monthly shooting star candle was formed which coincides with resistance at the 2008 top. Most of the time when a price is approaching previous resistance the first reaction will be a rejection, which translates into a sell down. That’s the argument for resistance. And it is pretty amazing that market indices were being hammered with Dow Jones Industrial Average (DJIA) drop 665.75 points the following day.
Where do we go from here, is the question top of mind of investors.
The price zone of 32-46 is a highly volatile zone at which InvestingHaven’s team expects consolidation to take place over the next few weeks or even months. Although most investors, including ourselves, tend to focus on projecting upside targets, we always (!) look at downside support as well. The next crucial support for ITB will be around 32-34 which can materialize in the next 1-2 months if prices drop fast from here. To cater for the question on what happens if this crucial support zone fails we will be looking at the 22-23 level in the ITB ETF which is where the channel support lies.
Ultimately, projection is only a guideline of what could happen in the future, we will let the market speak, and revisit as market activity develops.


