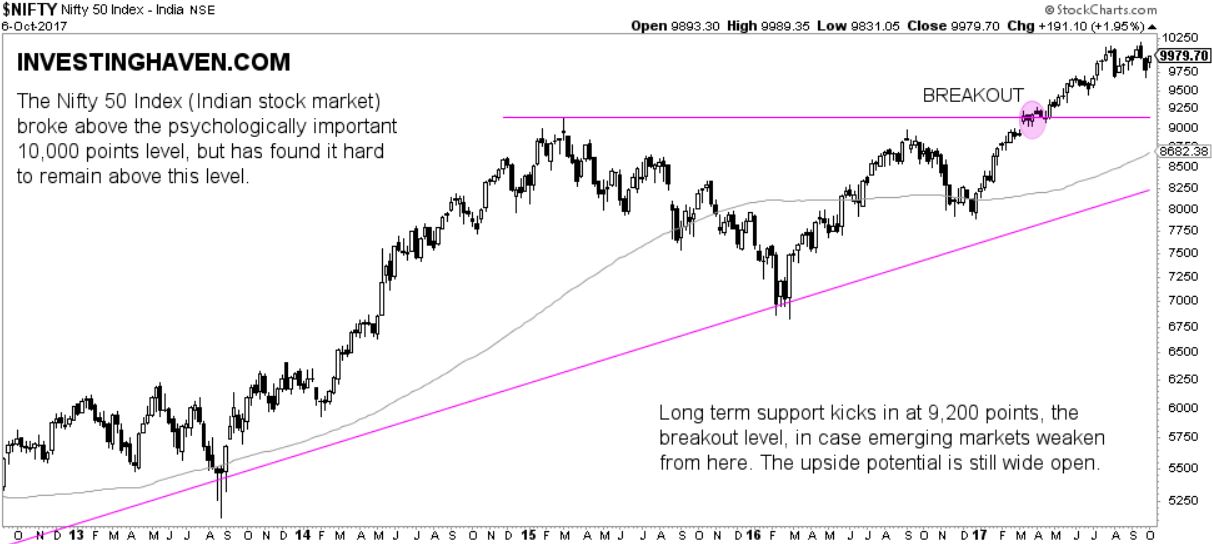
Several readers asked us this week to publish an update on the Indian stock market after we wrote mid-September that the India Stock Market Remains Bullish.
In order to come up with an answer to this type of question it is mandatory to check at least two timeframes: the daily and weekly charts. Less critical is the monthly chart, as pattern changes do not occur often on that timeframe.
The daily Indian stock market chart shows a potentially concerning event. We look at the Nifty 50 which represents the 50 largest stocks in the Indian stock market. The Nifty 50 crossed twice the psychologically important level of 10,000 points, once in July and once in September. Since then, however, it retraced and even got outside of its rising trend channel, on the daily chart.
The Nifty 50 needs to get back above 10,000 points in order to remain bullish. The recent breakdown is not concerning yet, but it could become a big deal, depending on how fast (or not) it gets back into its rising channel.

Next to the daily chart it is key to also monitor what happens on the weekly chart. That is because the weekly shows a much larger timeperiod in which more important (read: dominant) patterns are at play.
The weekly chart of the Nifty 50 still looks awesome although a potential double top could be at play. That is a second reason why it has to rise above the 10,000 level pretty soon: continued weakness from here would mark a breakdown on the daily as well as a double top on the weekly.
For now emerging markets continue to look bullish. The Indian stock market remains an outperformer as long as no major and unexpected events take place in global stock markets and particularly in emerging markets. If things get gloomy, as we forecasted in August ( Is The S&P 500 Correcting Towards 2125 Points ) though not materialized, the Indian stock market could suffer as well.


