Sometimes, a long-term view is significantly more instructive than its short-term counterpart. Trying to establish the future price of oil based on this past year, for example, would result in a positive outlook based on recent developments. Afterall, the price of oil clearly seems to be on the rise, from less than $30 per barrel earlier this year to more than $50 in just 10 months.
A short-term view, however, does not always result in accurate predictions. In fact, a long-term outlook on the crude oil forecast can result in very different conclusions.
Estimating the price of crude oil going forward tends to be difficult because of its volatile nature. Different time frames produce very different outlooks. Two charts in particular explain the unusually important decisions we’re facing with trading oil at this moment, an important consideration for any investor looking into the energy sector.
A 12-Year History of Crude Oil
Below chart paints a potentially dire situation of global oil prices. After spending about 4 years in a falling channel, prices dropped out in late 2014 and have failed to recover since. An attempt to break resistance and recover into the channel failed in 2015, leading to selling pressure that dropped the price below $30 per barrel earlier this year – unprecedented in recent memory.
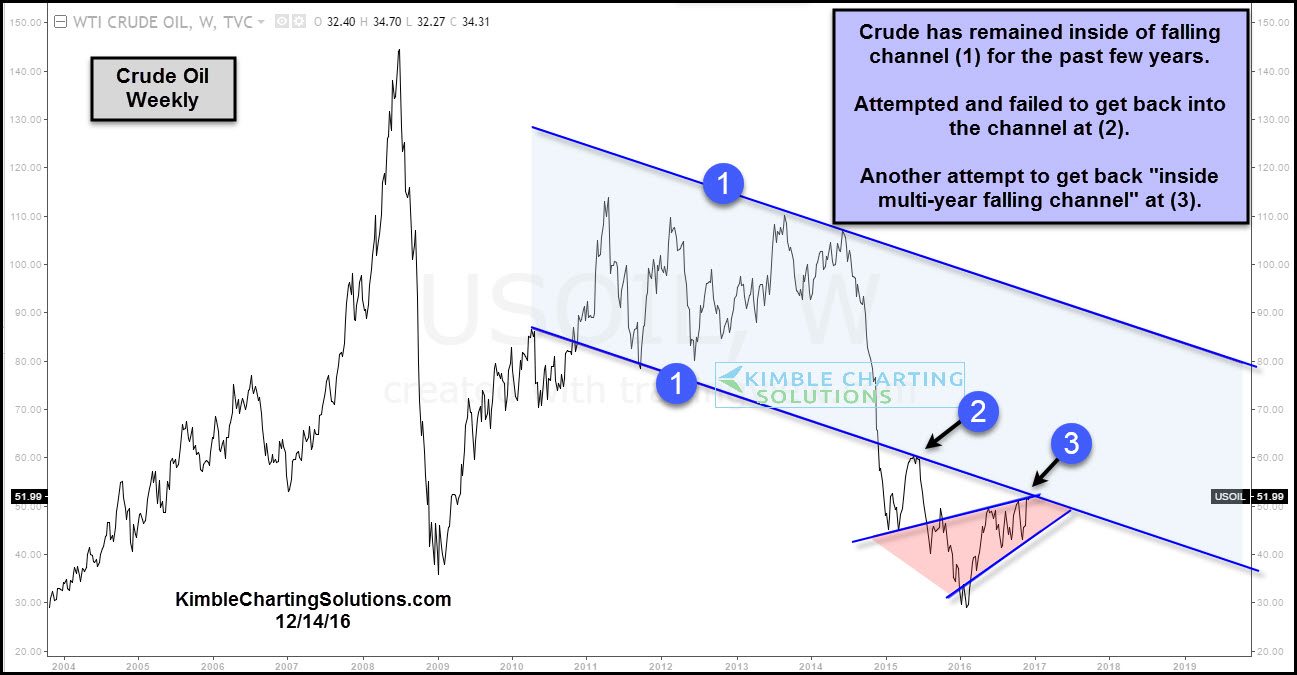
Since then, crude oil has recovered enough to once again knock on the door of the previously-established falling channel. But it has not re-entered that channel, leading to a crucial decision point: will the price once fall again, or will it continue a more positive upward trend, just as it did after the previous low in 2009?
Examining Larger Historical Trend Lines in Oil Prices
Twelve years may not be enough to answer the above question. So the second chart zooms out further, examining the past 30 years of oil prices. Here, we can both get a clearer look at the volatility of oil prices, and a more positive outlook on whether today’s price will break its resistance point.
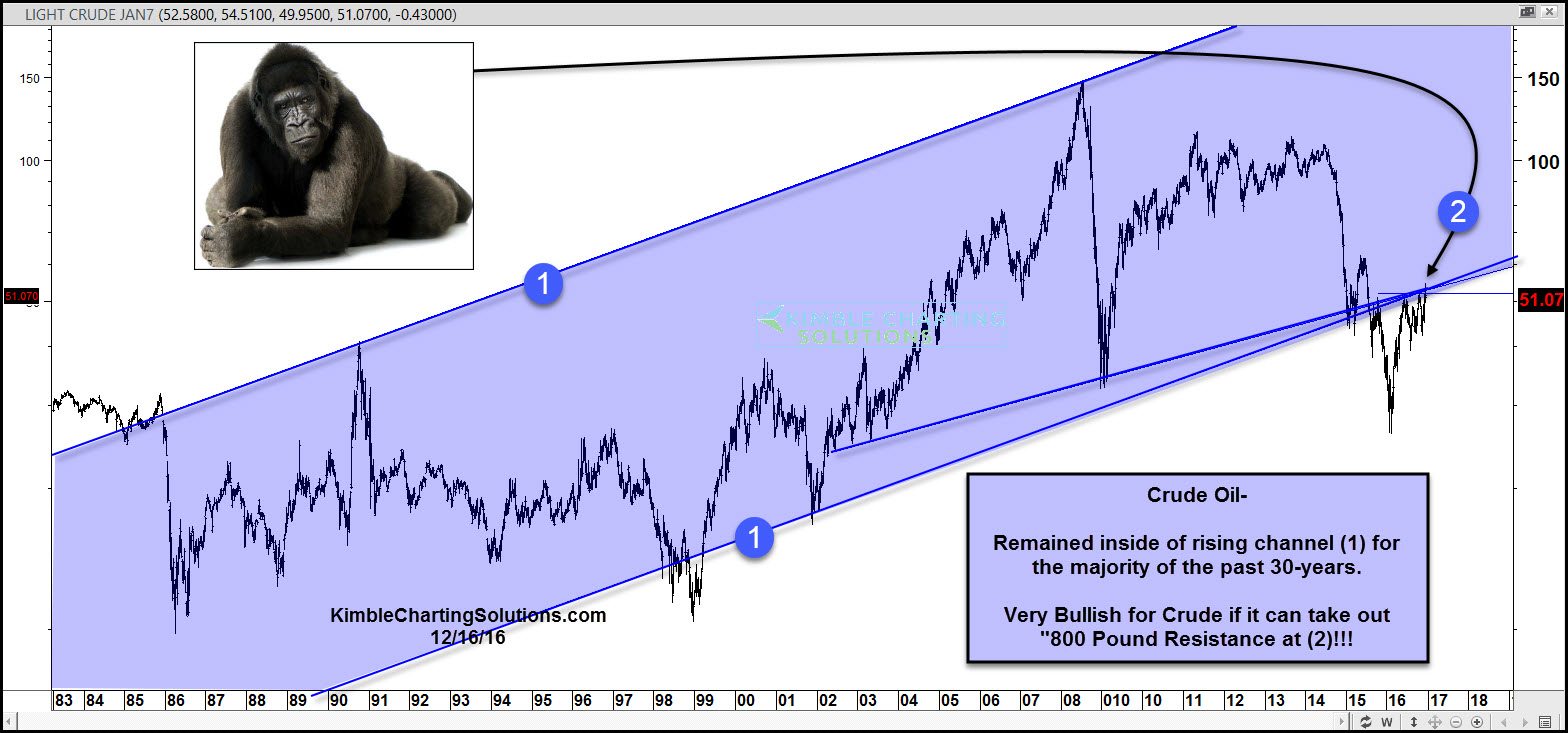
In its 30-year historical graph, crude oil has broken out of a larger rising price channel only once, and recovered easily. If it can continue recent trends and recover from its current collapse, it should re-adjust itself on the market to enter a rising trend curve once again. Investing now, in that case, could lead to significant returns.
What the 2 Charts Have in Common
Both charts, in short, offer different outlooks on what the future price of oil might look like based on historical trend data. They do, however, overlap on one conclusion: we’re at an unusually important point in time within oil trading.
The next few months will be critical in understanding the larger direction of the market. If oil prices continue to rise, we’re looking at the low point earlier this year as the turning point. Investing now, in that case, means significantly improving your returns as oil prices enter a growth phase.
But if they don’t, and selling pressure once again kicks in, the same low point could become a predictor to where we’re headed once again in the near future – causing investors to lose out.
Today’s Uncertainty of Oil Prices
Every investor wants to estimate and predict the future price of oil. If you know or can at least reasonably guess where it will land in the near future, you can make sound investment decisions in building your portfolio based on quantities rising in value.
Unfortunately, crude oil is and will continue to be unpredictable. Especially in the potential precipice that we find ourselves in today, gathering more information rather than simply relying on historical data is absolutely necessary in order to better predict the direction of oil prices.
Current estimates by the U.S. Energy Information Administration verify that unpredictability. While the EIA currently forecasts crude oil to be priced around $52/b in 2017, its 95% confidence rating places the price of oil in the near future between $34 and $71 per barrel. That significant variance points toward the need for gathering additional intelligence before making investment decisions.
Gathering Intelligence to Estimate the Future Price of Oil
Reading and understanding historical charts of crude oil prices is an important start to gathering that intelligence. In the recent past, $55 has seemed to be a potentially critical predictor of future trends. If prices (currently at $51) rise above that level, we may begin to feel more confident about a continuing upward trend. On the other hand, if they fall below $50 once again, investors should worry about developments that are similar to the previous breaking point.
A wide range of factors could influence either of these directions. OPEC’s recent decision to cut production has led to higher demand, leading outlets like CNN to suggest that we won’t see a valley close to $30/b anytime soon. Similarly, recent news about President-elect Donald Trump’s proposed export tax could impact the oil market as well.
But here is a simple truth: we don’t yet know how the market will react. Expert predictions could turn out to be true, causing a rise in oil prices and entering the previous price channel once again. Or the proposed measures could fail to make an impact, leading to renewed selling pressure that once again tumbles the price to a new low.
We all want to predict the future price of oil. But at times, there is no clear direction that can assist these types of predictions. In that case, the best financial decision is to gather intelligence, and watch the market closely. As it turns out, out-waiting overeager investors can lead to significantly more sound financial decisions in a volatile market like oil.
Charts are courtesy of Chris Kimble from Kimble Charting Solutions


