Silver seasonality can be a very powerful tool. In this analysis, we feature multiple historical silver seasonality charts to discover silver seasonality patterns.
Silver, like many other commodities, exhibits seasonal patterns that investors can use to inform their investment strategies.
By analyzing historical data, we can identify recurring trends that help predict silver market movements.
RELATED – The 50-year silver price chart
This blog post explores the seasonality of silver through a detailed examination of 4 silver seasonality charts, covering both long-term historical patterns and more recent trends from 2020 to 2024:
- Seasonal silver price trends over 52 years
- Seasonal silver price trends 1986 to 2016
- Silver price seasonality 2005 to 2024
- Silver price seasonality 2020 to 2024
- Seasonality comparison with 2020-2024
The comparison between these periods reveals shifts in market dynamics and potential opportunities for silver investors.
December 15th – Today, we update the 2020-2024 silver seasonality chart. With the latest data points, we look at the months ahead (January till April 2025) and we conclude the following:
- Silver had a very strong track record of moving strongly higher in the period Jan-April until 2019, with March typically a month of retracement.
- This pattern changed since 2020; in fact, it’s the exact opposite since 2020, with March being a strong month but February the weakest of the year.
Silver seasonality is partially helping us to understand if 2025 will be a typical or atypical month.
1. Seasonal silver price trends – the last 52 years
The first chart we examine highlights general seasonal trends in silver prices over a typical year.
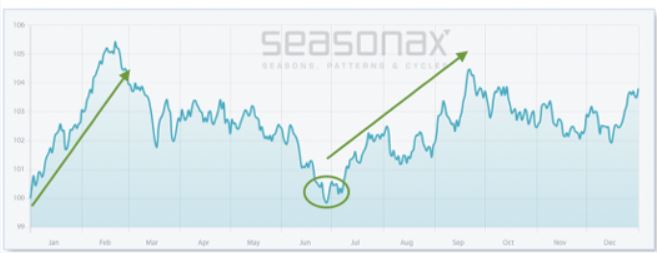
Courtesy of Seasonax – h/o Dimitri Speck.
These trends offer a foundational understanding of when silver tends to perform well and when it typically faces headwinds.
- Rising Trend from January to March: The chart shows a strong upward trend starting from January and peaking around March. This indicates that silver generally experiences positive momentum in the first quarter of the year.
- Mid-year weakness in June: A sharp decline is observed around June, which marks a period of weakness for silver. For investors, June might be a time to be cautious, either by holding off on new purchases or by taking profits on earlier positions.
- Recovery and peak from July to September: After the mid-year dip, silver prices tend to recover, with a notable upward trend from July to September. This pattern suggests a second opportunity for gains in the market.
- Stability from October to December: From October to December, prices show relative stability with smaller fluctuations. This period could represent a consolidation phase where the market is absorbing previous gains or reacting to end-of-year economic data.
Revealed silver seasonality insights: Key periods to watch are March and September as potential peaks, while June appears to be a notable low point. Investors should consider these seasonal movements when planning their entry and exit strategies.
2. Seasonal silver price trends – 1986 till 2016
The second chart delves into the seasonal average for silver spot prices over a 30-year period.
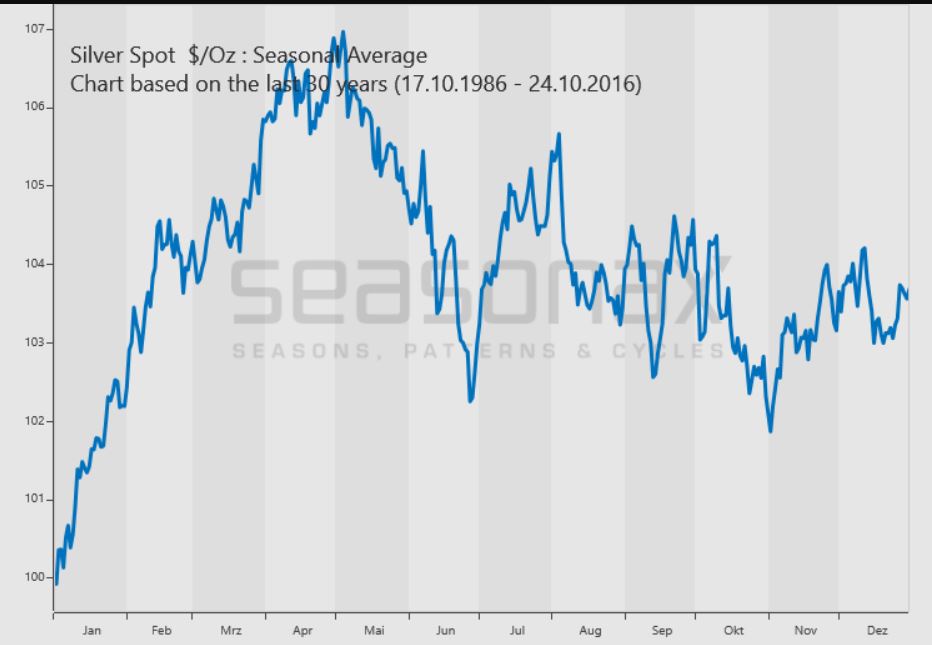
This silver seasonality chart provides a historical baseline for understanding silver’s seasonality.
- Early year strength: The data shows a significant increase in silver prices from January, reaching a peak in March. This aligns with the general seasonal trend observed in the first chart and suggests that the first quarter is a strong period for silver, possibly due to increased demand from industrial and investment sectors at the beginning of the year.
- Mid-year correction and stability: Following the March peak, prices tend to drop sharply through April to June. After this correction phase, the prices stabilize around mid-year, likely as the market recalibrates from the earlier surge.
- Fluctuating later half of the year: From July to December, the chart shows a fluctuating pattern with no consistent upward or downward trend. This variability suggests that external factors, such as geopolitical events or macroeconomic data releases, could significantly influence silver prices during this period.
Revealed silver seasonality insights: The historical trend shows strong seasonality in the early months of the year, with a peak in March, a dip mid-year, and no consistent pattern in the latter half. This implies that investors should pay particular attention to the first quarter for potential buying opportunities, while the middle of the year might be better suited for caution.
Ed. note – Could April 2025 be the month in which silver moves to 50 USD an Ounce?
3. Silver price seasonality – 2005 till 2024
The fourth chart expands the analysis to a longer-term period from 2005 to 2024.
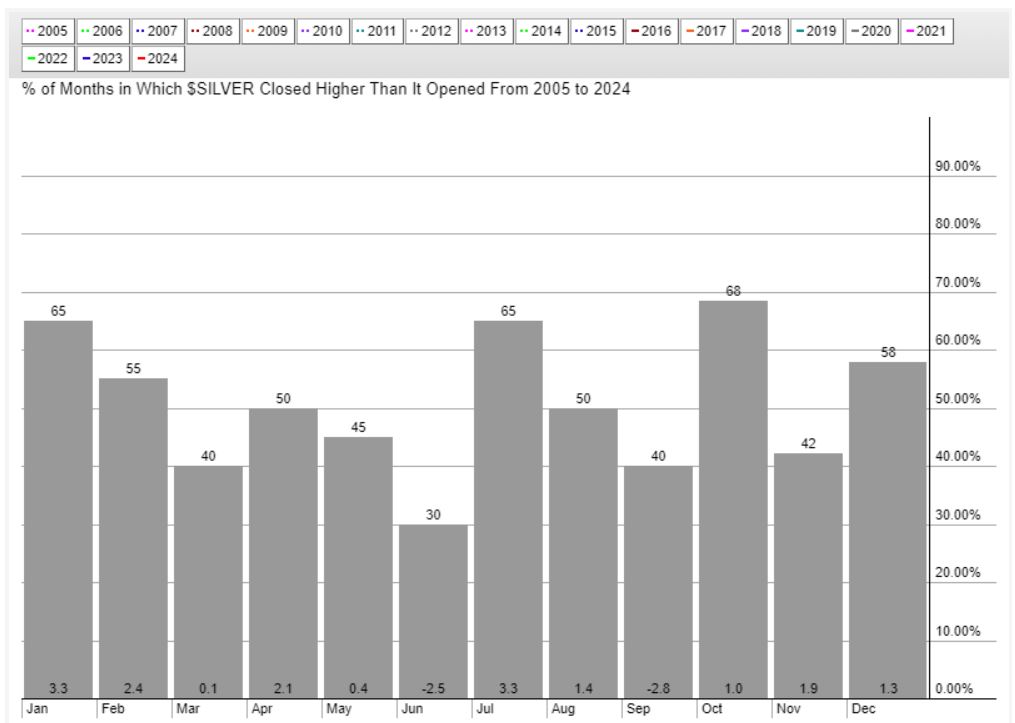
Silver seasonality chart created by Stockcharts.com.
This silver seasonality chart allows us to see if the observed recent trends align with or deviate from longer-term patterns.
- Consistent strong months – January and October: January (65%) and October (68%) remain strong months in the long-term analysis, indicating a degree of consistency in positive performance. These months may reflect regular cycles in industrial demand or investor repositioning at the start and end of the year.
- Variable and mixed months: Other months like February, May, and July show more mixed results, with lower probabilities of positive returns. This variability could be influenced by a range of factors, including economic data releases, currency fluctuations, and geopolitical events that affect silver’s role as both an industrial metal and a safe-haven asset.
Revealed silver seasonality insights: The extended period analysis reinforces some seasonality trends but also shows variability across months that are not as evident in shorter periods. This suggests that while some seasonal trends are reliable, others are more susceptible to change based on broader economic conditions.
4. Silver price seasonality – 2020 till 2024
The third chart provides a more recent look at silver’s monthly performance from 2020 to 2024.
December 15th – This silver seasonality chart was updated today. Especially the September, November and December data are adjusted. September showed consistent bad performance up until 2024, while silver came down in November 2024, so the % occurrences in which silver moved up in November came down. Interestingly, the key take-aways are not affected with this new silver seasonality chart.
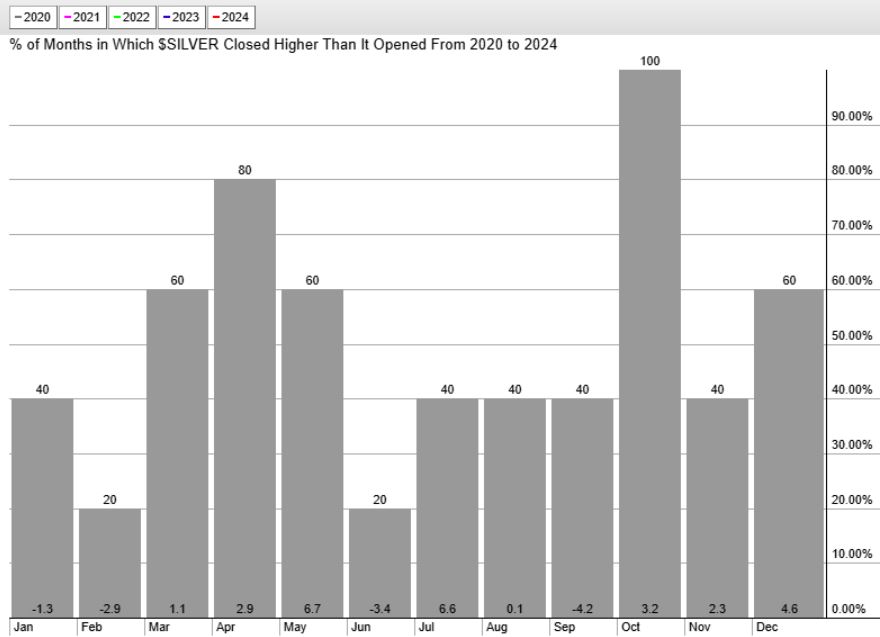
This shorter time frame helps identify whether recent market conditions have altered silver’s seasonality.
- Strong performers – April and October: April and October (80% and 100% of occurrences) are standout months with high probabilities of silver closing higher than it opened. This suggests that these months have been particularly favorable for silver investors in the last four years.
- Weak performers – February and June: Conversely, February and June show lower positive returns (20-40% of occurrences). This indicates that these months may be periods of consolidation or correction, where silver faces more headwinds.
Revealed silver seasonality insights: The recent 4-year period suggests a shift toward stronger performance in the later months of Q4, especially in October and December, compared to historical trends. This shift could be due to recent global economic dynamics, including the COVID-19 pandemic’s impact on market behavior.
Comparative analysis: Last 4 years (2020-2024) vs. previous periods
Having looked at the individual charts, it’s crucial to compare the recent 4-year period (2020-2024) against the previous periods to understand shifts in seasonality trends.
1. Performance shifts in key months
- January and October: Both the 2005-2024 and 2020-2024 periods show October as a strong month, but January has shown a decline in its seasonality strength in recent years. This could be due to changing economic conditions, such as shifts in monetary policy, inflation expectations, or industrial demand patterns.
- April and December: There is a marked improvement in these months in the recent period (April: 80%, December: 60% of occurrences), compared to more mixed performances in the longer term. This indicates that external factors in the past few years, such as economic stimulus measures, have favored silver prices during these months.
2. Weakness consistency
- June and September: Both periods consistently show June and September as weak months for silver. This trend suggests these months are traditionally bearish or face stronger headwinds, such as market corrections or reduced demand. This consistency allows investors to maintain similar strategies over time regarding these months.
3. Stability in performance
- Mid-year fluctuations: The longer-term data (2005-2024) shows more stable fluctuations mid-year compared to the recent period (2020-2024), which has shown more volatility in some months. This could reflect recent global market uncertainties, such as supply chain disruptions, changes in economic policies, and varying investor sentiment.
Silver seasonality: Key takeaways
This comprehensive analysis highlights both long-standing and emerging trends in silver’s seasonality:
- Some months, such as October and June, show consistent patterns over a very long period of time.
- Recent data from 2020 to 2024 reveals significant shifts in the performance of certain months, like April and December.
These changes suggest that investors need to remain adaptable, combining insights from long-term historical data with recent trends to make informed decisions.
December 15th – As said in the intro, there is a strong divergence in silver seasonality since 2020 compared to the history prior to 2020. It is very difficult to forecast that the first months of 2025 will bring given this divergence.
For investors, this means that while it is essential to consider historical silver seasonality trends, one must also stay attuned to recent silver market dynamics that could alter these patterns.
Silver’s performance can be influenced by a myriad of factors—from global economic conditions and monetary policy changes to geopolitical tensions and shifts in industrial demand. Therefore, a balanced approach that combines historical insights with current market analysis is likely the best strategy for understanding the silver market.


