InvestingHaven’s research team is keen on identifying new and potentially massive moves in any asset or market. In today’s article we try to determine whether the Spanish stock market is on the verge of a big move.
Spain being part of the European Union has its own stock index, i.e. the IBEX 35.
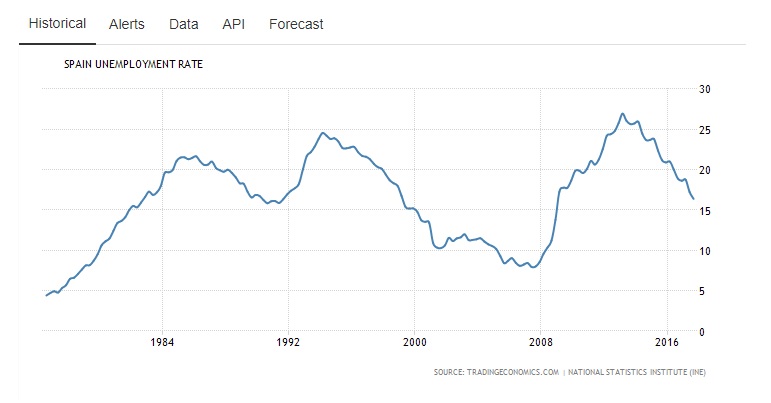
Right after the financial crash of 2008 the unemployment rate in Spain rose sky high to dizzying levels. It reached an astonishing 26% in 2013. That is the equivalent of 1 out of 4 adults being jobless in that year. The almost hopeless situation turned around after some drastic labour reform initiatives.
Just when it looked like the unemployment situation improved significantly Spain experienced one of the greatest political hiccups in the December 2015 General Election. There was no party taking the majority of votes, and the fragmented parliament couldn’t produce a stable governing coalition after countless of negotiations. This situation resulted in a re-election on 26 June 2016, and finally a proper ruling government emerged.
Historical chart of Spain Unemployment Rate
All these major events in the unemployment rate as well as political (in)stability are reflected in the Spanish index – IBEX 35. It is the benchmark stock market index of the Bolsa de Madrid, Spain’s principal stock exchange. Initiated in 1992, the index is administered and calculated by Sociedad de Bolsas, a subsidiary of Bolsas y Mercados Españoles (BME), the company which runs Spain’s securities markets (including the Bolsa de Madrid). It is a market capitalization weighted index comprising the 35 most liquid Spanish stocks traded in the Madrid Stock Exchange General Index and is reviewed twice annually.
Spain stock market index: outlook for 2018
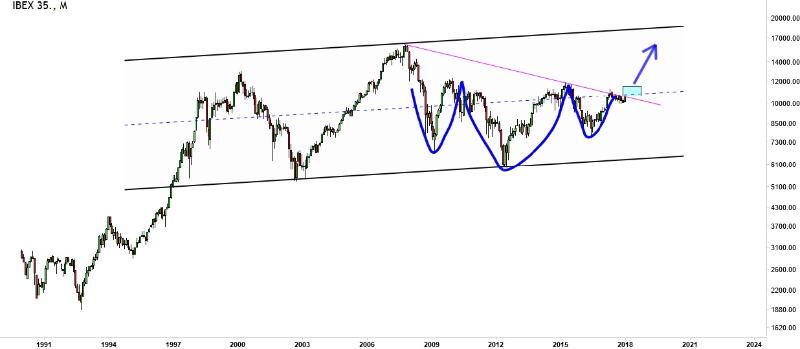
There was a dynamite growth from 1992 to the top of 2000 that coincided with the global dotcom bubble. The index recovered early 2003, and made a five year sprint before hitting a major wall which coincided with the global financial crisis of 2008. Ever since, the price movement was more erratic. The trend channel annotated on our chart illustrates the massive consolidation of price for 20 years since 1997 and InvestingHaven considered this as a potentially massive bull flag. Due to the uncertainty in Spain from 2008 to present, price has fluctuated below the median line most of the time, and ultimately morphed into a potential inverted head and shoulders. Traditionally, price of this pattern is bullish unless price moves swiftly in the different direction.
Historical monthly chart of IBEX 35
The continuous disputes (battles) between Spain and Catalan independence referendum could be tricky for the index. However, InvestingHaven takes the cue from price structure, and has a bullish bias given the current state of the market reflected in the IBEX35 chart.
Price is again hovering around the median line for a major decision. In case price breaks above the median line which we highly suspect will happen the next target for 2018 will be ~12000 which is also the neckline zone of inverted head and shoulders. On a bearish note, if price takes the opposite route and dives dow, ~10,000 will be immediate support follow by 9500 which will change our bullish outlook to ~9500.


