
On October 18th, 2024, silver confirmed its breakout. Our silver price forecast of $34.70 will be crushed. Silver will touch $37.70 in 2024. Moreover, silver’s move to $50 is now confirmed.
NEW – Our silver price prediction for 2025 & beyond.
Silver continues its move higher, in line with our silver price forecast. While our first bullish target of $34.70 was almost hit, it looks like our second target of $48-$50 is now officially postponed to mid-2025 as per the silver chart setup of June 21st, 2024.
October 21st – The research team at InvestingHaven.com research team confirms its silver price target 2024 to be touched very soon: $34.70. this brings the next bullish silver target to the forefront: $37.70. Once both are cleared, we expect a quick rise to $48-$50, to be hit in the period April through June 2025. There is lots of excitement on cash tag $SILVER; even banks are turning bullish on silver.
READ – Silver seasonality catalyst for silver price in the next 4 months.
We expect silver to move higher in 2024 because the top in Yields is confirmed. Silver and Yields are inversely correlated. Our bullish silver price forecast 2024 is supported by silver’s 4 leading indicators:
- Gold’s secular bull market;
- Yields setting a top;
- USD is lacking bullish momentum;
- Inflation expectations respecting their uptrend.
In this article, we focus on the details how we derive our bullish silver forecast. Readers that are not interested in the details, can focus on the outcomes, conclusions, summaries provided in this long article.
Our silver forecasts: a deep understanding of the silver market, hard work, over many decades
At InvestingHaven, we do the hard work, the genuine forecasting work. The information in this silver forecast is the result of two decades of hard work, analyzing markets, particularly precious metals, focusing on understanding price influencers.
This silver price forecast is created based on a deep understanding and thorough analysis of silver price influencers.
Nowadays, the web is full of fake silver price forecasts. Many sites publish large tables, generated by AI, with price calculations for the next years, positioning those endless series of numbers as silver price forecasts. There is no silver forecasting involved in this; it’s price dumps practice which leaves the reader confused.
Silver forecast analysis: outline
We have a very different view on how to predict the price of silver. If you are looking to understand the true dynamics driving the silver price, you will love our silver price prediction methodology.
- 1. Silver prediction: summary
- 2. Another Silver Price Prediction: Why?
- 3. Leading indicators supporting our silver price prediction
- 4. Our silver price prediction 2024
- 5. Silver charts that support our forecast
- 6. Silver’s leading indicator #1: Gold
- 7. Silver’s leading indicator #2: Euro (USD)
- 8. Silver’s leading indicator #3: Inflation expectations
- 9. Silver’s leading indicator #4: Futures market (CoT)
- 10. Physical silver market: physical shortage in 2024
- 11. Silver price chart: a bullish reversal is almost complete
- 12. Silver price forecast 2024: conclusion
- 13. Our track record predicting the price of silver
Here are the 4 decisive silver price influencers for our silver forecast 2024:
- Gold price: bullish even though hitting resistance. Read also our latest gold prediction 2025, 2026, 2030.
- 10-Year Yields: topping, inversely correlated to silver.
- USD: not experiencing a bull run.
- Silver CoT: not bullish unfortunately.
October 1st, 2024 – China’s massive stimulus package is expected to support precious metals prices.
Silver prediction: summary
We re-iterate our bullish stance about the silver market. Our silver price target stands strong.
The summary of our silver forecast 2024:
For 2024, we continue to predict that silver will rise to 28 USD/oz which is a secular breakout level. Whether it will succeed in clearing secular resistance will depend whether 10-Year Yields will confirm a local top. Stated differently, TNX is the last obstacle for silver to move higher. Once silver moves to 28 USD/oz, it will run quickly to the 32-36 area, a move which we expect to occur in the first half of 2024.
For 2024, we firmly believe that silver has everything that it needs to stage a secular breakout in 2024. In other words, our expectation is that silver will break out in the first part of 2024. That’s why we prefer to wait for silver to clear 26 USD/oz which will open the door to move to 28 and 34.70 USD/oz.
July 14th, 2024 – Our silver forecast, discussed in the previous paragraph which we published in Oct of 2023, came true today! While 34.70 USD/oz was not touched, not yet, it looks like there is still a possibility that this will happen, either late 2024.
RELATED – Can The Silver Price Hit $100 an Ounce?
4 leading indicators supporting our silver price prediction
We work with a limited number of leading indicators for our silver price predictions:
- The price of gold (positively correlated to silver).
- The Euro (inversely correlated to the USD).
- Inflation expectations (positively correlated to silver).
- The futures market positioning (CoT).
In 2022, we noticed how a strong rise in the U.S. Dollar and consequently big decline in inflation expectations broke the secular breakout in silver that started in Q1. However, the silver CoT report continued to improve to the extent that it became historically bullish in Q3.
We believe that all leading indicators will turn bullish for silver in 2024, the only one that needs confirmation is 10-Year-Yields: if prices of Treasuries move a little higher, Yields a little lower, it will open the door for silver to move to our projected targets, first $34.70 followed by $50.00 sooner or later.
Our silver price prediction 2024
We turn to the silver charts to support our silver price forecast 2024.
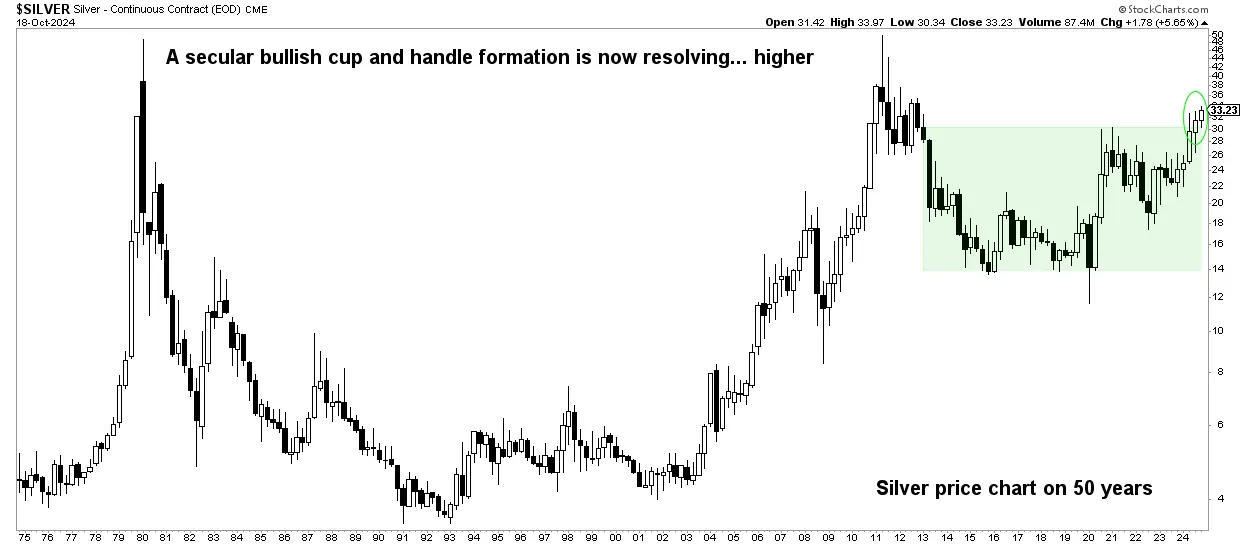
As seen on the longest timeframe, the silver price chart over 50 years, there is a giant cup and handle in the making. This is a strongly bullish pattern, one that might take two more years to truly explode.
The area in green is the ‘handle’, it took some 6 years to create the first part of the structure. The consolidation is taking some 3 years now. We find it challenging to estimate the exact time required for this formation to complete. We can reasonably expect silver to move to the top of this formation (between 32 and 36 USD) in the first half of 2024.
Related – When Will Silver Hit $50 An Ounce?
September 24th, 2024 – While the silver price retraced, just slightly, mid-summer 2024, it seems to not have affected the long term chart setup at all. Silver is, since September 24th, 2024, back above the big consolidation area indicated in green on its 50-year chart. This silver chart is unusually and insanely bullish.
October 21st – The longest term silver price chart is undeniably powerful. This chart screams: silver ATH underway. We would add: silver is not going to stop at its current ATH.
Silver charts that support our forecast
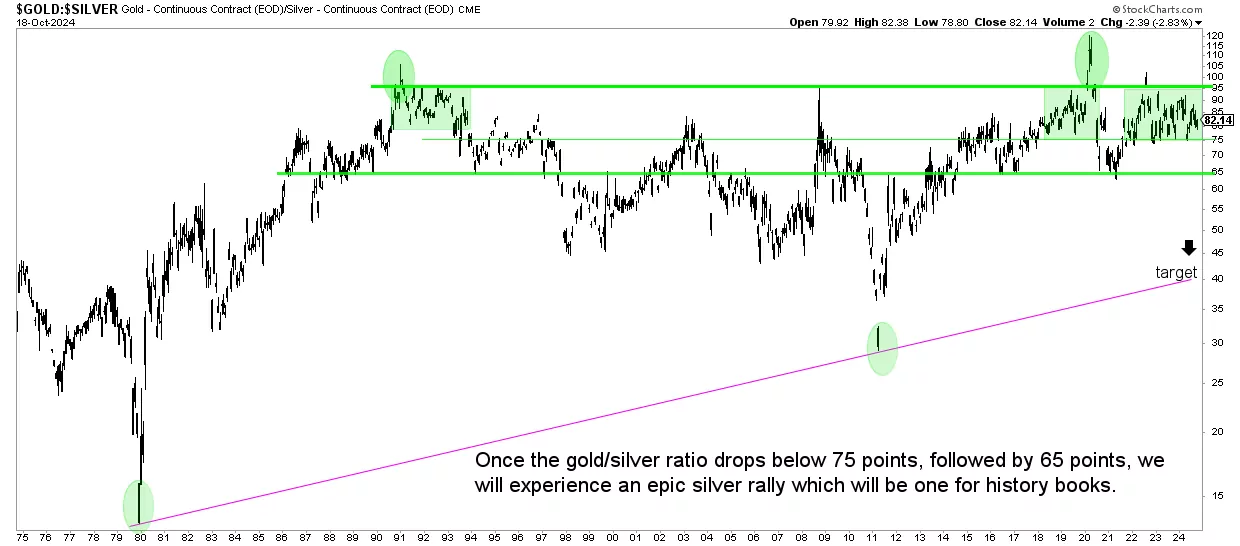
We start with the weekly gold to silver ratio over 50 years.
We explained the importance and the meaning of the gold to silver ratio, in great detail, in this article: Gold-to-Silver Ratio and Historic Silver Rallies:
The historical evidence suggests that the gold-to-silver ratio entering the 80 to 100x range may act as a signal for a significant rally in the price of silver. At this very point in time, the gold to silver ratio chart embedded in this article shows how this ratio is above 80x since early 2022. This ratio is not a timing indicator, it is a stretch indicator. It suggests that silver is extremely undervalued relative to gold, it suggests that it’s a matter of time until spot silver starts reacting to the upside!
The gold to silver ratio chart over 50 years is shown below.
We set a target of 40 points in the gold to silver price ratio. For this target to be hit, silver has to double with gold being equal. We believe this target of 40 points may be hit either by mid-2024 or otherwise mid-2025.
August 12th, 2024 – As the gold to silver price ratio did not fall below 75 points, it ‘had to‘ bounce back higher. From support to resistance, that’s how all charts move. Eventually, silver will outperform gold and once the break below 75 points happens in gold to silver.
October 21st – The gold to silver ratio is now getting close to the magic and important 75 point level. See above for why this is not just important, but it will be crucial and decisive.
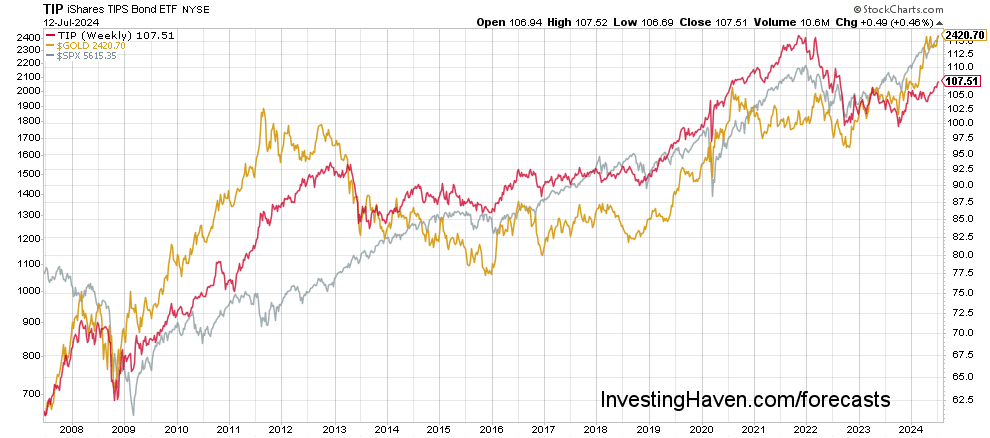
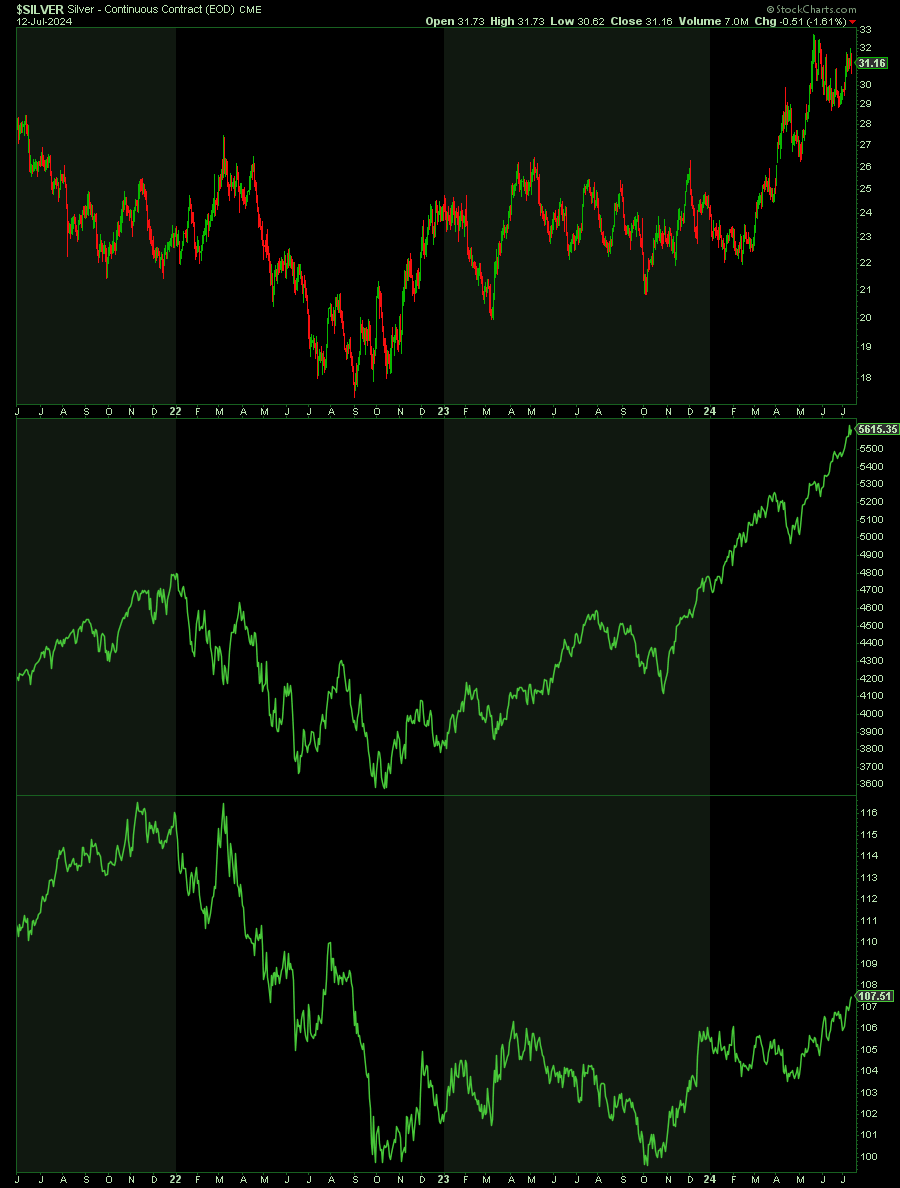
The 2nd chart that supports a higher spot silver price in 2024 is the correlation between inflation expectations (TIP), gold and SPX.
The decline in 2022 in all 3 of them is telling. We expected that all 3 of them will stop declining and turn up in 2023, which happened although without follow-through.
With the correlation between those 3 markets in mind, we look at the current setups in silver / TIP / SPX.
Silver is setting a very strong inverted head & shoulders pattern, stocks are setting a double bottom (pending validation though), TIP looks to be consolidating.
October 21st – The correlation between gold, S&P 500 and inflation expectations (TIP) is striking. This correlation implies that the current market environment is ideal for precious metals; gold requires a positive market environment to do well (contrary to common belief which is that gold needs economic uncertainty to do well).
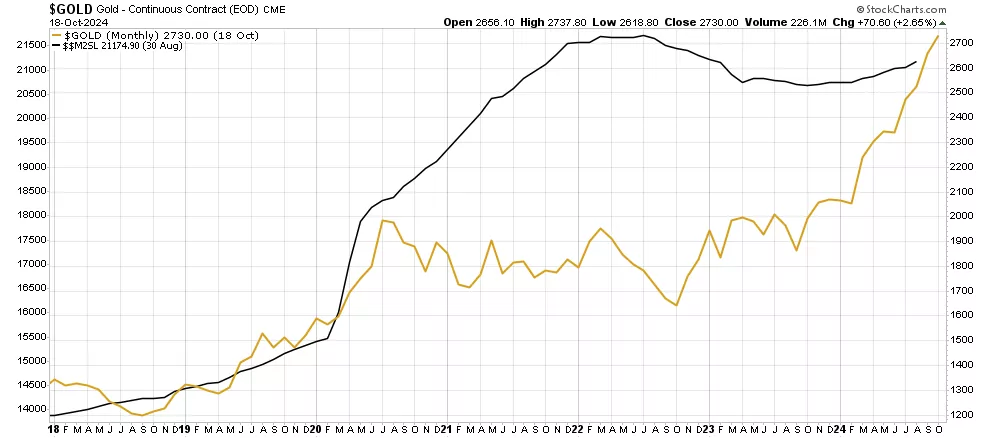
Silver’s leading indicator #1: Gold
We expected gold to eventually move higher in 2023, and it happened, driven by the divergence between its leading indicator M2 (the monetary base). The way we look at this leading indicator is that it is now supportive while it had a negative divergence a while ago.
October 21st – The gold price rally is justified, is what the following correlation chart tells us. This bodes very well for silver and our silver forecast!
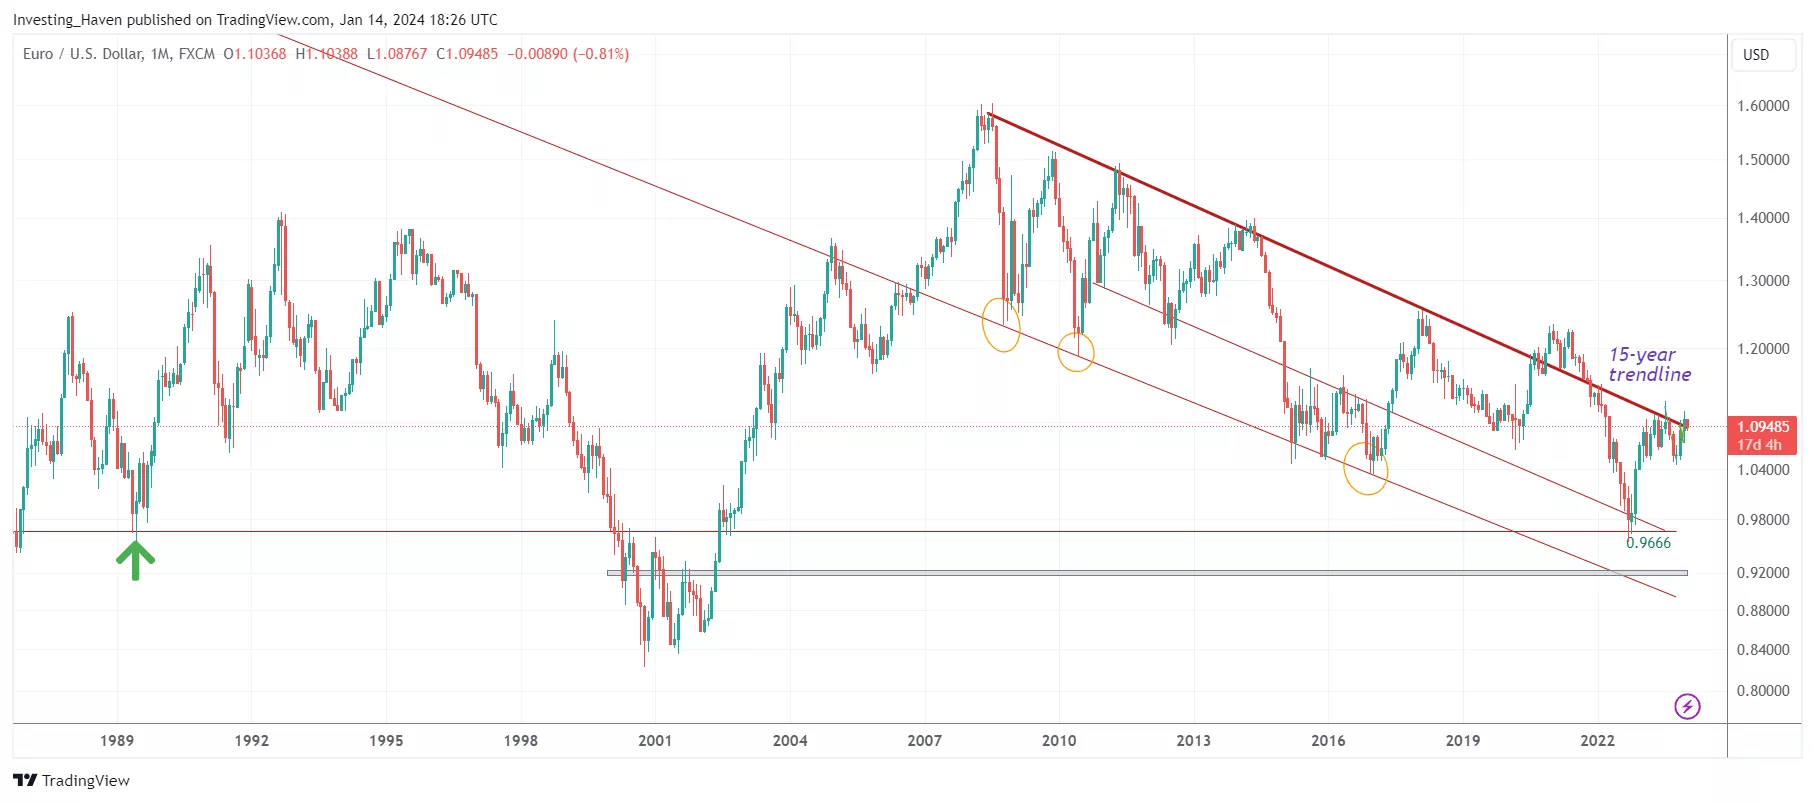
Silver’s leading indicator #2: Euro (USD)
Precious metals need a rising Euro (falling or flat USD) in order to shine.
If we look at the Euro chart on the longest timeframe we find 2 bearish targets: 0.9666 and ultimately 0.91-0.92. The first one was hit, a big bounce was triggered.
August 29th, 2024 – We see a strong price action in EURUSD in August of 2024. This is very supportive for precious metals. The probability of the USD to stage a strong bull run in the foreseeable future, which would be bad news for precious metals, is now very low.
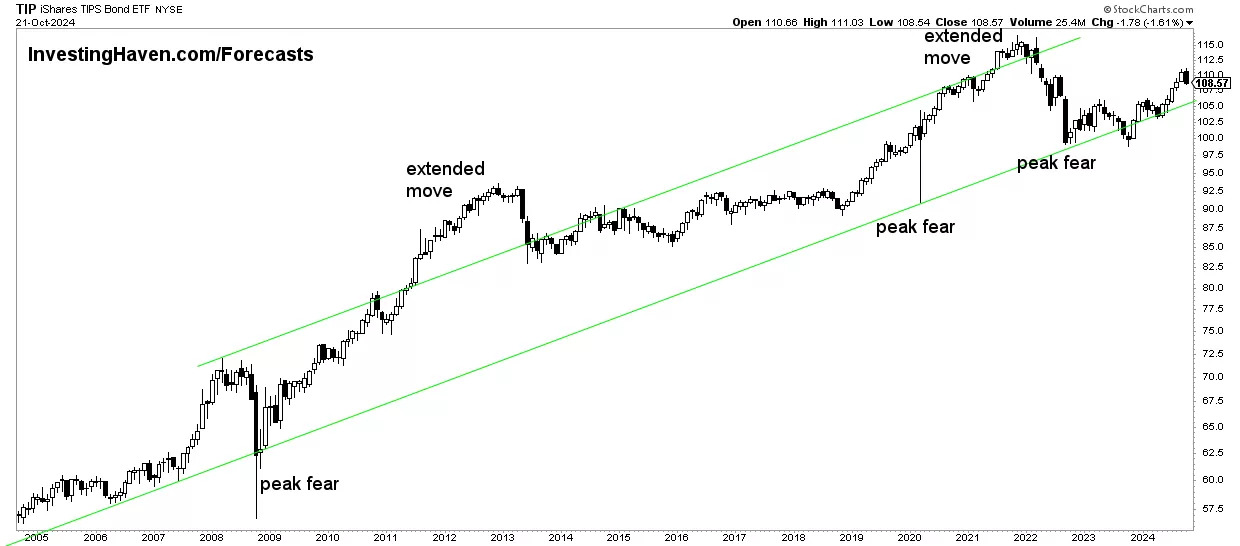
Silver’s leading indicator #3: Inflation expectations
Inflation expectations are positively correlated to precious metals. They are a very strong a leading indicator, certainly when combined with the USD/ Euro effect.
The long term setup in TIP seems to be hitting a multi-decade low in the context of its rising channel. Can TIP move lower? While everything is possible, we see that the recent decline was equally large as the previous ones in 2008 and 2020. That’s why we believe TIP is about complete its consolidation and move higher in 2024. We see a double bottom between Oct 2022 and Oct 2023 which should resolve higher, making it possible for silver to stage its long-overdue and long-awaited rally in the first half of 2024!
October 21st – This is the fundamental catalyst for both gold and silver – inflation expectations (TIP ETF). The continued rise in TIP is one of the most reliable leading indicators for the bull markets in both gold and silver. It is THE indicator that confirms our bullish silver predictions are justified.
The medium term chart of silver / SPX / TIP, shown below, makes the point: a turning point in all three markets is not far away. All three should resolve higher in 2024.
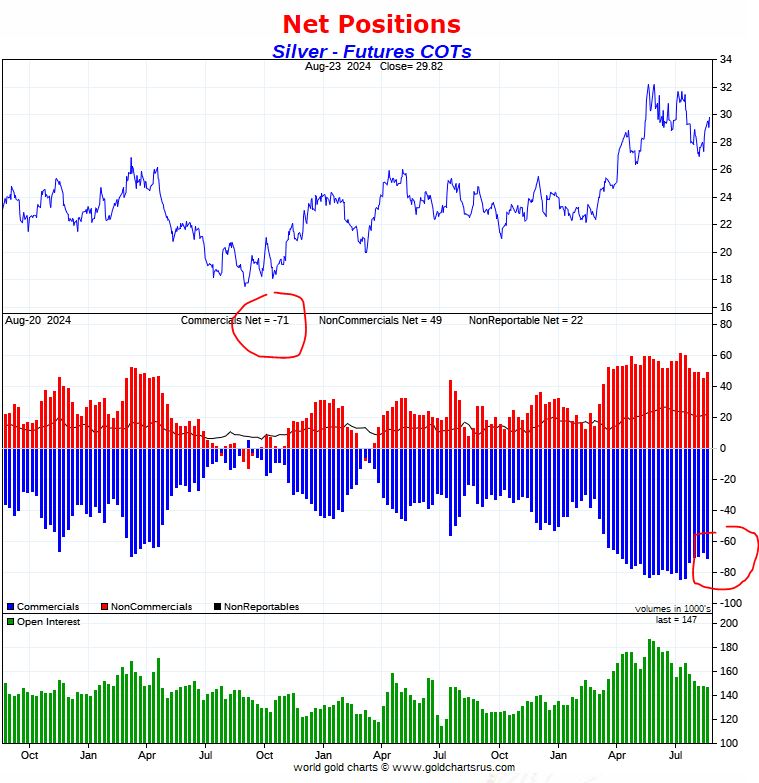
Silver’s leading indicator #4: Futures market (CoT)
This is the most bullish leading indicator for silver, way before 2024 kicks off. This leading indicator will act like fuel in 2024 whenever the other leading indicators turn bullish for silver!
The way to think of this leading indicator for silver is a stretch indicator:
- When net positions in the futures market of commercials and non-commercials are stretched it indicates that price is going to take a turn.
- This is not a timing indicator, we need the silver price chart to determine the timing of a turning point.
- Right now, as per the data on the center pane (blue and red bars) we see that commercials and non-commercials have extremely low net positions, historically low. This is a setup that supports rising silver prices.
- What we want to see in 2024 is the red and blue bars rising not so fast as the price of silver is moving towards 28 USD, the secular breakout point.
We recommend reading Ted Butler’s work who is the expert in reading the CoT report in silver. He also explains how price setting in the silver market is dominated by CoT. He is a lonely voice in pointing out how tight the physical silver market currently is, as we head into 2024, because of an epic turnover in physical silver warehouses.
August 29th, 2024 – The silver CoT report turned very bearish in April of 2024 with red hot readings in net positions of commercials. Silver is now back to a more healthy situation. The point is that this report shown below acts as a stretch indicator – extreme positions in net short positions of commercials do not allow for lots of upside in the price of silver.
Physical silver market: physical shortage in 2023 & 2024
As discussed in our recent article that talks about the developing silver shortage, a supply deficit is growing in the physical silver market.
According to The Silver Institute) the global silver market should record a deficit in 2022. “At 194 Moz, this will be a multi-decade high and four times the level seen in 2021.”
As seen on the table which depicts the supply/demand situation in the last 10 years, it becomes clear that 2023 will be year with a structural and undeniable physical market shortage. The strength of the physical shortage is the one conclusion that stands out, see red annotation.
As said, “this physical market imbalance (supply shortage) is historic, it’s not just a big supply shortage jump of 4x against last year.”
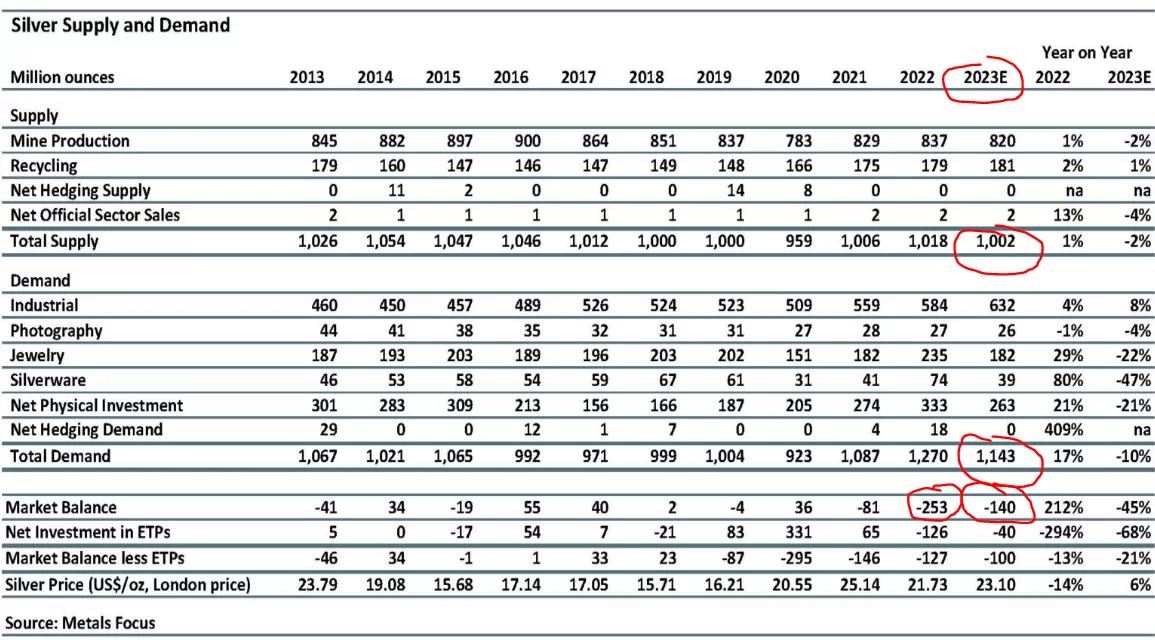
The shortage did not resolve in 2024. In fact, there is an increasing number of signs that the shortage is only intensifying. Sooner rather than later, silver’s physical market shortage should be reflected in the price of silver.
Silver price chart: a bullish reversal is almost complete
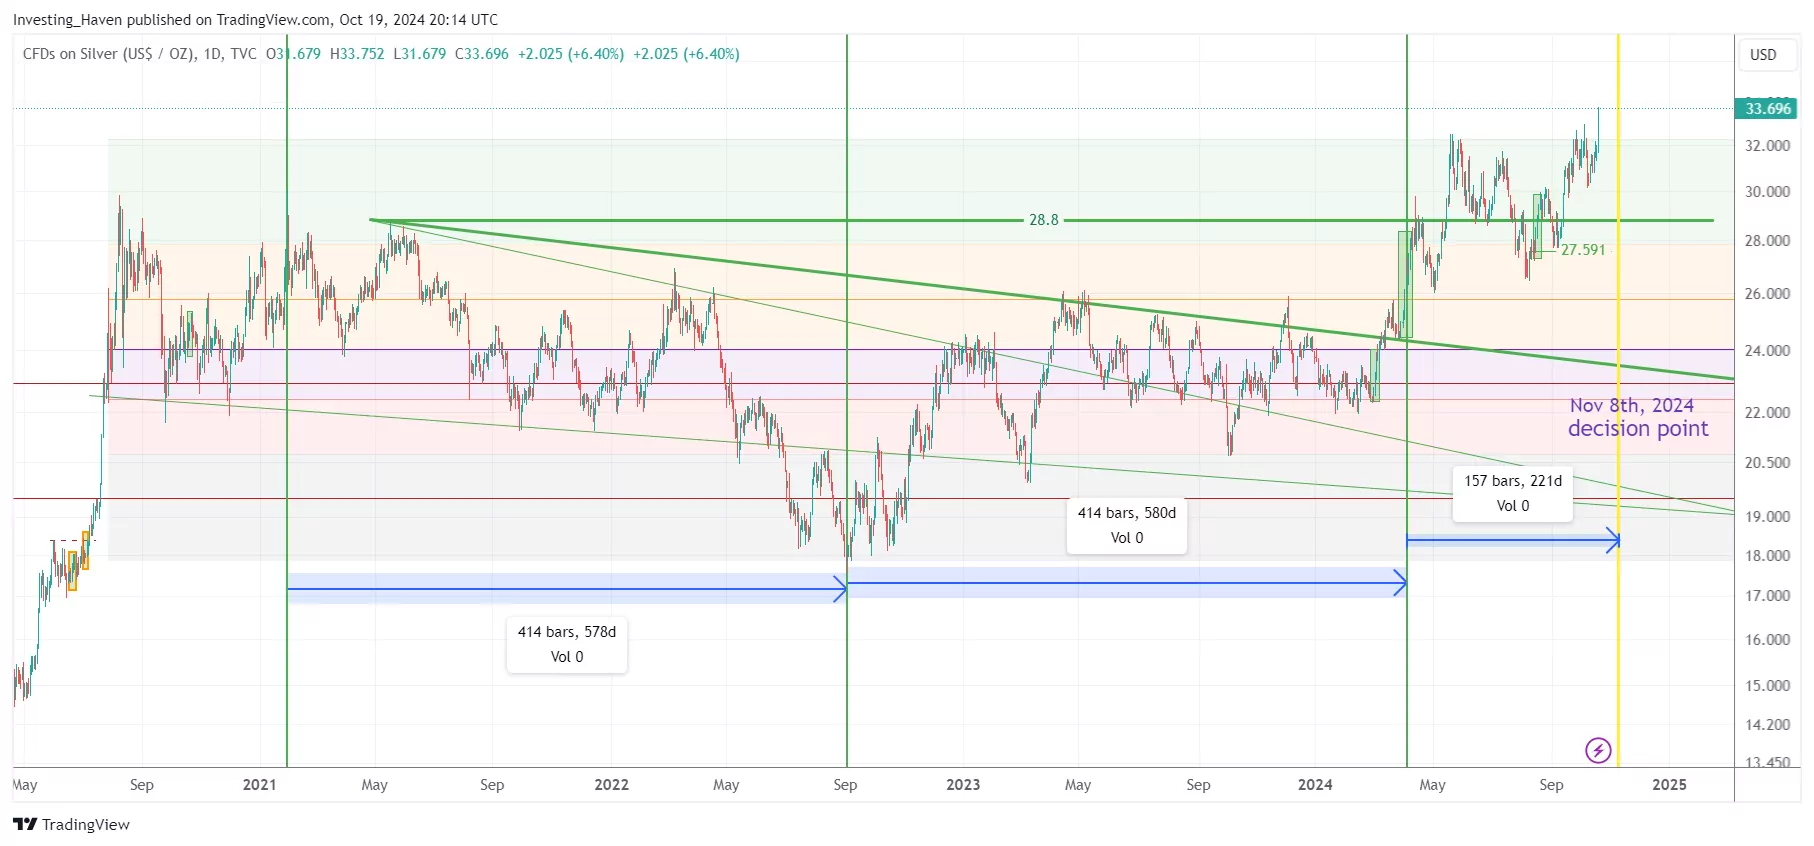
A bullish reversal setup that is testing the edges. While not really visible on this chart, there is a rounded pattern that already resolved and is testing the breakout point (23 USD/oz).
Remember, the longer a consolidation goes on, the more powerful the outcome will be. While, emotionally, a long consolidation is no fun for most investors, the reality is that the longer term implications of a long consolidation are bullish.
July 14th, 2024 – Silver is now working on a bullish reversal. On July 3d, 2024, a successful test of the breakout level at 28.80 USD/oz took place. IF resistance at 33 USD/oz is cleared, silver will move to our bullish target of $34.70, and maybe even continue to $37.70 in the short term.
September 24th, 2024 – Silver confirmed, today, that it wants to crush its 2024 highs. It is ready for a move to our long standing target of 34.70 USD/oz. Arguably, silver is not going to stop there, it wants to move to 37.70.
October 21st – The
Silver price forecast 2024: conclusion
That was a lot information to take in, so let’s ensure we come to a very clear and simple conclusion:
- Leading indicators Euro and inflation expectations turned bearish in Q2/2022, pushing silver lower.
- The silver CoT turned extremely, historically bullish as we head into 2024.
- Once inflation expectations start rising, accompanied by a confirmed top in 10-Year Yields, we silver see taking off.
That’s why we see silver easily moving to 28 USD in 2024 and moving to our first and longstanding bullish target of 34.70 USD. Our silver price forecast 2024 is 34.70 USD. Whatever happens at that price point will inform us about the intention of silver to attack ATH, presumably beyond 2024.
CONTINUE READING – How To Invest In Silver in 2025
Our track recording predicting the price of silver
Between 2017 and 2021, our silver forecasts were phenomenally accurate. Those silver predictions are all still available on our public blog. The table below depicts the summary of each year’s silver forecast with the highs/ lows per year.
Interestingly, InvestingHaven’s research team has been spot-on with its gold price forecasts for 5 consecutive years. However, in 2021 and 2022, the price of silver came close to our silver forecast. It eventually did not exactly touch our forecasted price.
We firmly believe that our silver price forecasts of 2022 and 2023 will materialize in 2024. Our longstanding targets are 34.7 and 50 USD. We firmly believe that silver will rise to both targets in 2024 and 2025.
This is an overview of our silver price forecasts from last year. We publish these forecasts many months prior to the year that we forecast. Prices reflect silver's spot price.| Silver forecast from the past | Silver prices from the past | Our accuracy |
|---|---|---|
| 2017 | neutral | $15 | $14.41 - $18.65 | Spot-on |
| 2018 | neutral | $13.91 - $17.68 | Spot-on |
| 2019 | bullish | $20-21 | $14.30 - $19.64 | Spot-on |
| 2020 | bullish | $22 | $11.65 - $29.64 | Spot-on |
| 2021 | bullish | $34 | $21.42 - $30.37 | Accurate |
| 2022 | bullish | $34 | $17.83 - $26.90 | Missed |
| 2023 | bullish | $34 | $20.01 - $26.06 | Missed |
Weekly Gold & Silver Price Analysis
Our public blog posts typically share high level insights that are not actionable. For actionable insights, we recommend considering our detailed gold & silver price analysis. It is a premium service, covering leading indicators of the gold price and silver price. Premium service: Gold & silver price analysis >>