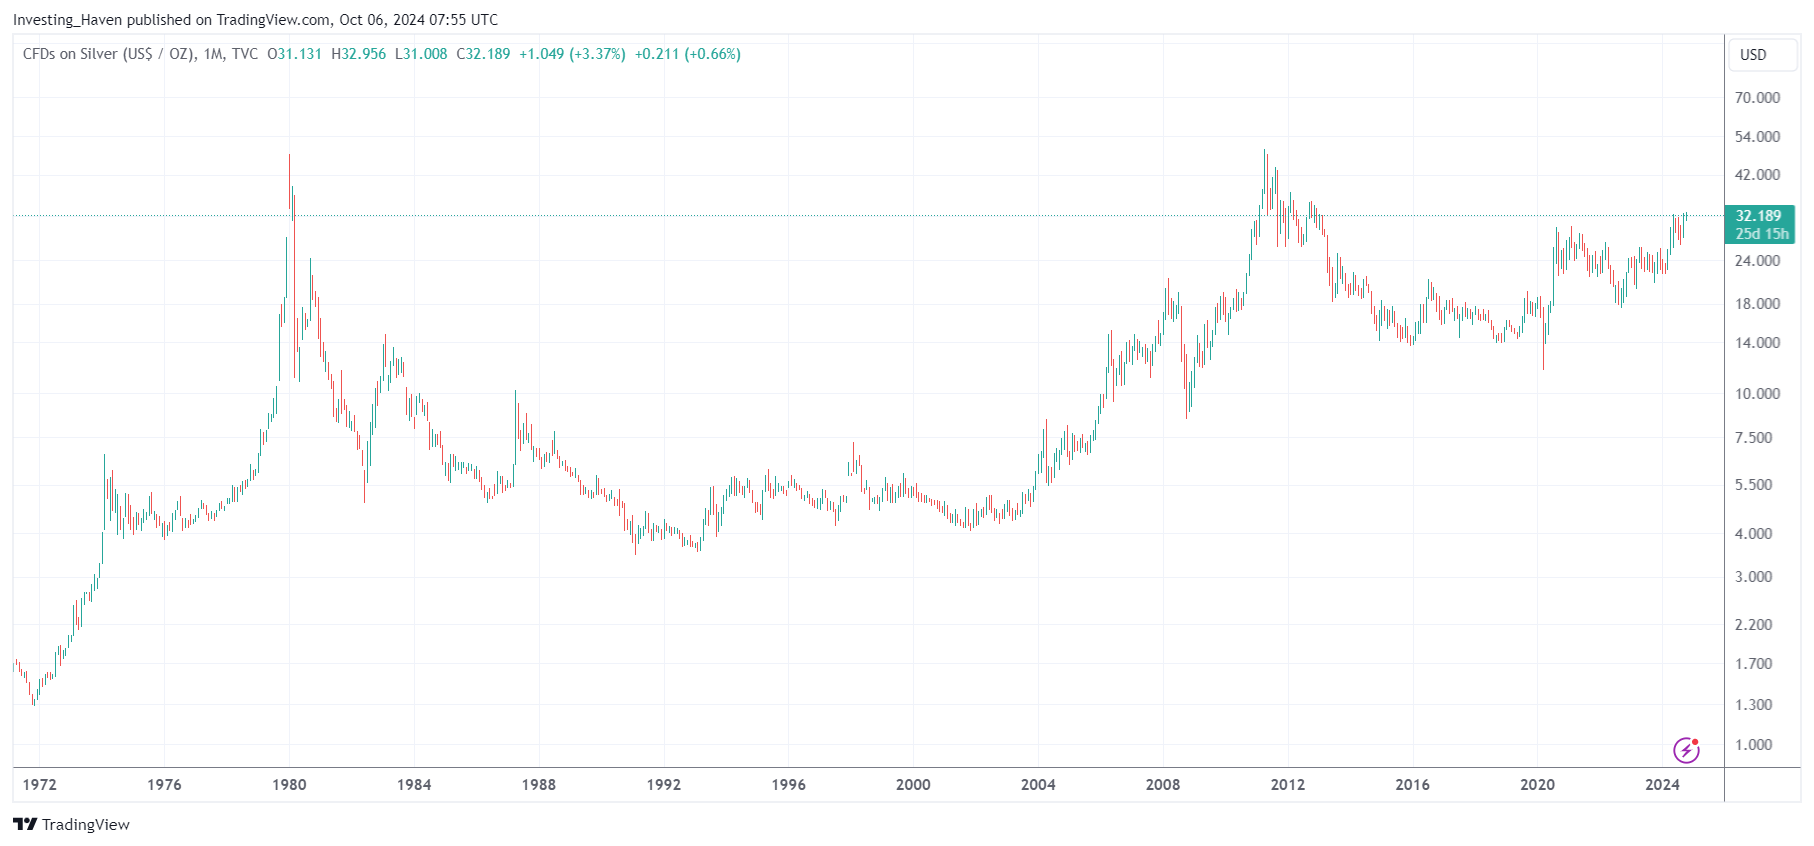
Arguably, the long term silver chart qualifies as the most powerful bullish reversal ever, especially because of its unusual length.
RELATED – When Exactly Will Silver Hit $50 An Ounce?
One thing is clear – this chart pattern is immensely powerful.
What is not clear, however, is when silver will set new all-time highs.
While a test of current ATH is likely to happen late 2024 or the first half of 2025, it remains unclear if/when/how silver will break out to new ATH.
We had a theory about this, and explained it here: Can The Silver Price Rise To $100?
Silver chart bullish reversal
While the intellectual part of solving the question ‘when will silver hit $50‘ and ‘will silver ever hit $100‘ is challenging (hence fun to do), the bigger picture point is the current silver chart setup.
In order to see and appreciate the power of silver, one has to zoom out.
Remember – short term chart views create 100% noise in 100% of occurrences. Yet, the web is full of it, just scroll down to find that most of the ‘silver trade ideas‘ are short term oriented.
As seen on below chart, a giant cup and handle formation is unfolding on the silver chart. The current outcome is consistent with our latest silver price prediction!
Catalyst driving the silver chart bullish reversal
Investors in the West have not been paying attention to the big boom in precious metals.
That’s probably because it’s just the beginning of the ride, and the best is yet to come. This is an important finding from In Gold We Trust 2024:
A recent study reveals that 75% of surveyed managers have minimal to no exposure to gold, with none exceeding a 10% allocation.
Our latest special report is a deep dive into the optimal allocation of gold in your portfolio.
1/2 pic.twitter.com/ArgVREnZFd— In Gold We Trust (@IGWTreport) August 30, 2024
As seen above, precious metals allocations in Western portfolios is close to non-existent.
It begs the question – how much higher need gold and silver prices go before Western investors get interested?
In the meantime, gold and silver are in high demand in the Easter hemisphere. Central banks are hoarding gold like crazy in recent years. Specifically silver demand, in China, seems to be in overdrive:
CN industrial silver consumption has exceeded 90%, with photovoltaic silver consumption exceeding 5000 t and electrical electroplating silver consumption exceeding 3000 t, resulting in a significant increase in total demand. pic.twitter.com/EaBXmDmrQ8
— Bai, Xiaojun July 1, 2024
Silver’s next big move
What could be next for silver, acknowledging the silver chart bullish reversal that is solidifying with each passing month?
While it’s a valid question, the right question to ask which timeframe is the relevant one.
Looking at the long term setup of silver, a move to $50 is unavoidable. But does it really matter if it happens during the summer of 2024, around year-end or around summer of 2025?
What truly matters is the long term pattern and trend.
We wrote a very insightful timeline analysis on silver, it’s available on Linkedin. Exceptionally, we revealed some insights that are typically reserved for premium members in our gold & silver research reports.
READ – The Most Insightful Silver Chart Analysis You Will Ever Read
That said, we derived specific dates that are likely going to be decisive in how silver resolves, presumably to the upside, given the current long term chart setup.
As we approach the decisive dates of November 8th, 2024, and January 21st, 2025, we will continue to monitor the market closely. This scenario is not a forecast but a way to illustrate our methodology.
Note that the dates we derived will be in a US Fed rate cutting period. This nicely lines up with historically important dynamics in the silver market as explained below:
#Silver returned average +332% in last three Fed rate cutting cycles pic.twitter.com/WJtzZuxLuR
— Peter Krauth July 10, 2024
Silver chart: price, time, both?
While the investor community remains focused on silver price analysis, we believe timeline analysis is equally important. One of the ways to go about timeline analysis is thinking in terms of cycles; the other method is calculating decisive dates.
We believe the current cycle has potentially some more upside potential, we shared a detailed analysis in our gold & silver market report this week. Anyone who signs up can access it immediately:
RECOMMENDED (sign up) – Special Edition Silver Analysis – Short Term Breakout Possible Or Not?
But the timeframe of the investor really is the only thing that matters. Looking at the long term silver pattern, the chart seems to suggest that timing is less crucial because the upside target of $48-50 is clear.
Long term investors should enjoy the silver ride, even though volatility is certainly going to pick up, around 32.70 USD/oz and certainly in case silver would succeed in moving a little higher (closer to 40 USD/oz). This area will be filled of volatile price action.
The question is (a) are you able to stomach volatility (b) are you in for the short or long term?
Take-aways about the silver chart bullish reversal
The long-term silver chart is currently showing one of the most powerful bullish reversals in recent history.
- A giant cup and handle pattern is emerging, signaling a potential price target of $50 per ounce.
- While it’s clear that silver is in a bullish trend, the timing of when it will reach new highs is still uncertain.
Some estimates suggest a test of the current all-time high by late 2024 or early 2025, but the breakout to new highs could take longer.
Despite the slow uptake in the West, silver demand is soaring in the East, especially in China. Industrial silver usage, particularly in photovoltaics and electroplating, has surged, driving significant demand. Western investors have largely remained underexposed to precious metals, but this could change as prices continue to climb.
For investors eyeing the long-term silver trend, the key question is not if, but when silver will hit $50 an ounce. Market volatility is expected around the $32.70 to $40.00 per ounce levels, but those who can stomach the ups and downs may find themselves well-positioned for silver’s next big move.
Keep an eye on key dates, like November 8, 2024, and January 21, 2025, as these could be crucial in determining the next phase of the silver chart bullish reversal.
Sign up to receive our premium silver alerts >>


