The big silver breakout is here with a breakout above $32.70, the most important level per our chart readings. This means that silver’s big ride might be here.
Is silver ready to start its journey to $50? It seems that the answer is YES, although it won’t move to ATH in one straight line.
READ – When Exactly Will Silver Hit $50 An Ounce?
The acceleration point might be here.
This is why.
The silver price breakout is here
Since 2 years, we are writing about the critical price point on the silver chart: $32.70.
That’s why it was the silver price target of our silver forecast 2023 and 2024. We missed our forecast in 2023 but it got hit in 2024. Right after hitting $32.70, silver retraced.
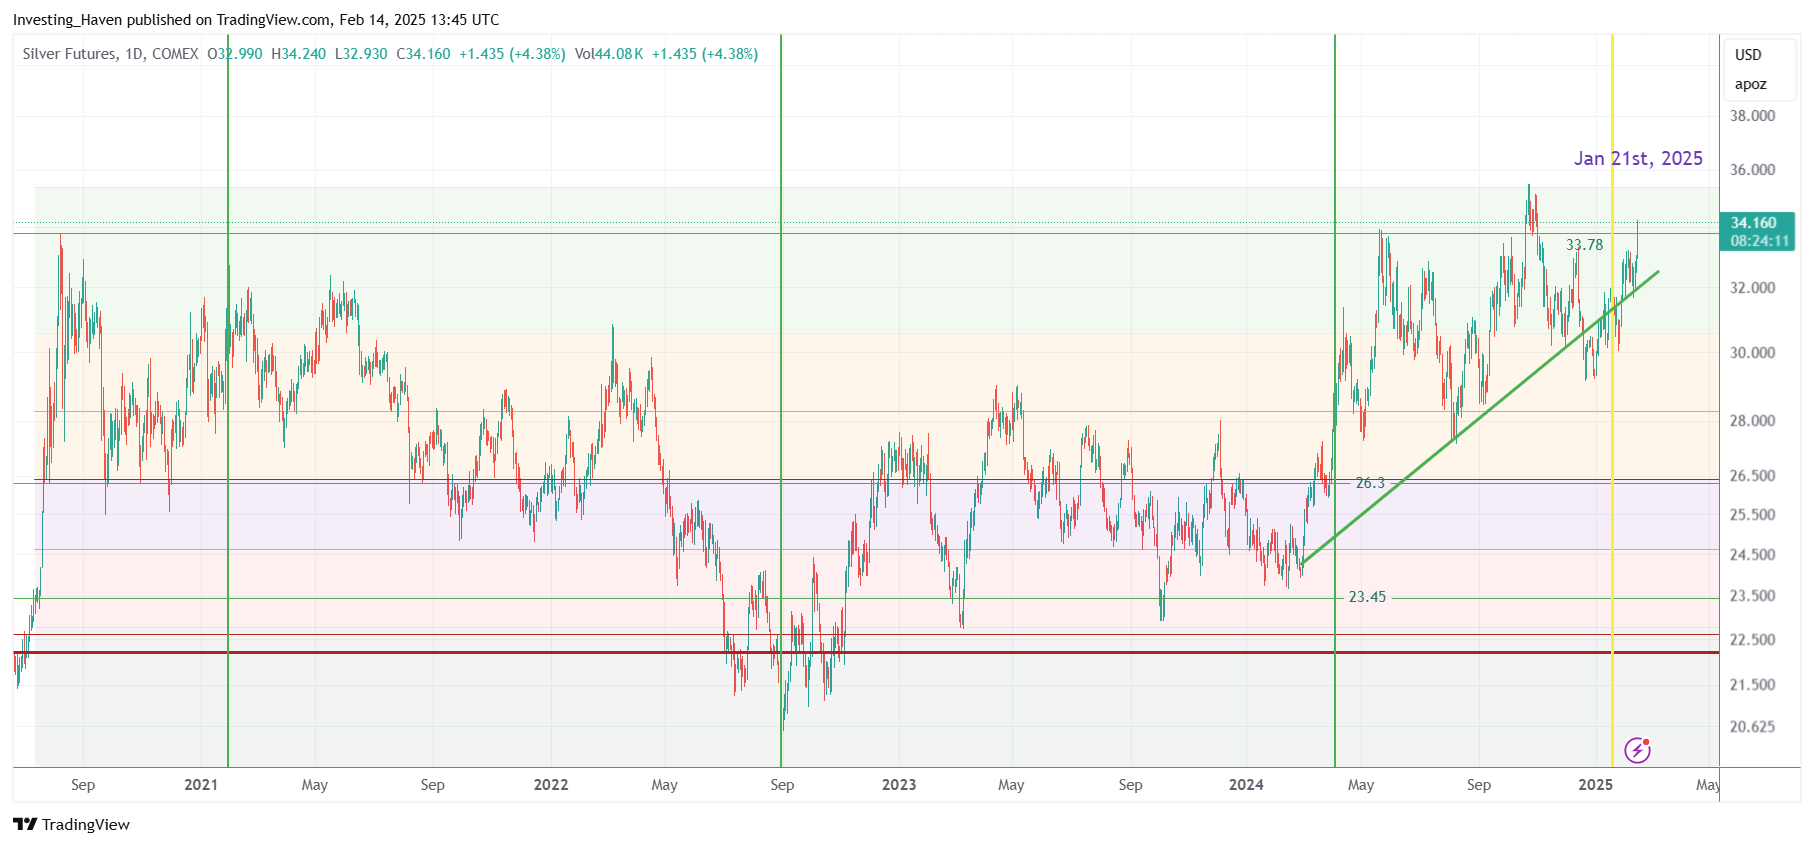
As seen on below chart, silver has been consolidating right below $32.70, for nearly 9 months now.
The chart pattern that silver printed below $32.70 is a W-reversal, a bullish pattern. A breakout is starting NOW, as we speak.
Needles to say, this silver chart is very, very bullish!
The 2024 rising trendline is respected, the Fibonacci levels are perfectly respected, and now $32.70 is giving up. What else does a silver investor need to be happy?
Is the silver breakout sustainable? Probably YES!
Silver cleared $32.70 twice before, since mid-2024. It failed twice.
Is this time different?
We think so, for a variety of reasons.
One reason is the silver price chart, daily timeframe, shown above. As said, the 2024 rising trendline is respected, the Fibonacci levels are perfectly respected, a triple top breakout may complete the W-reversal and make place for a new uptrend.
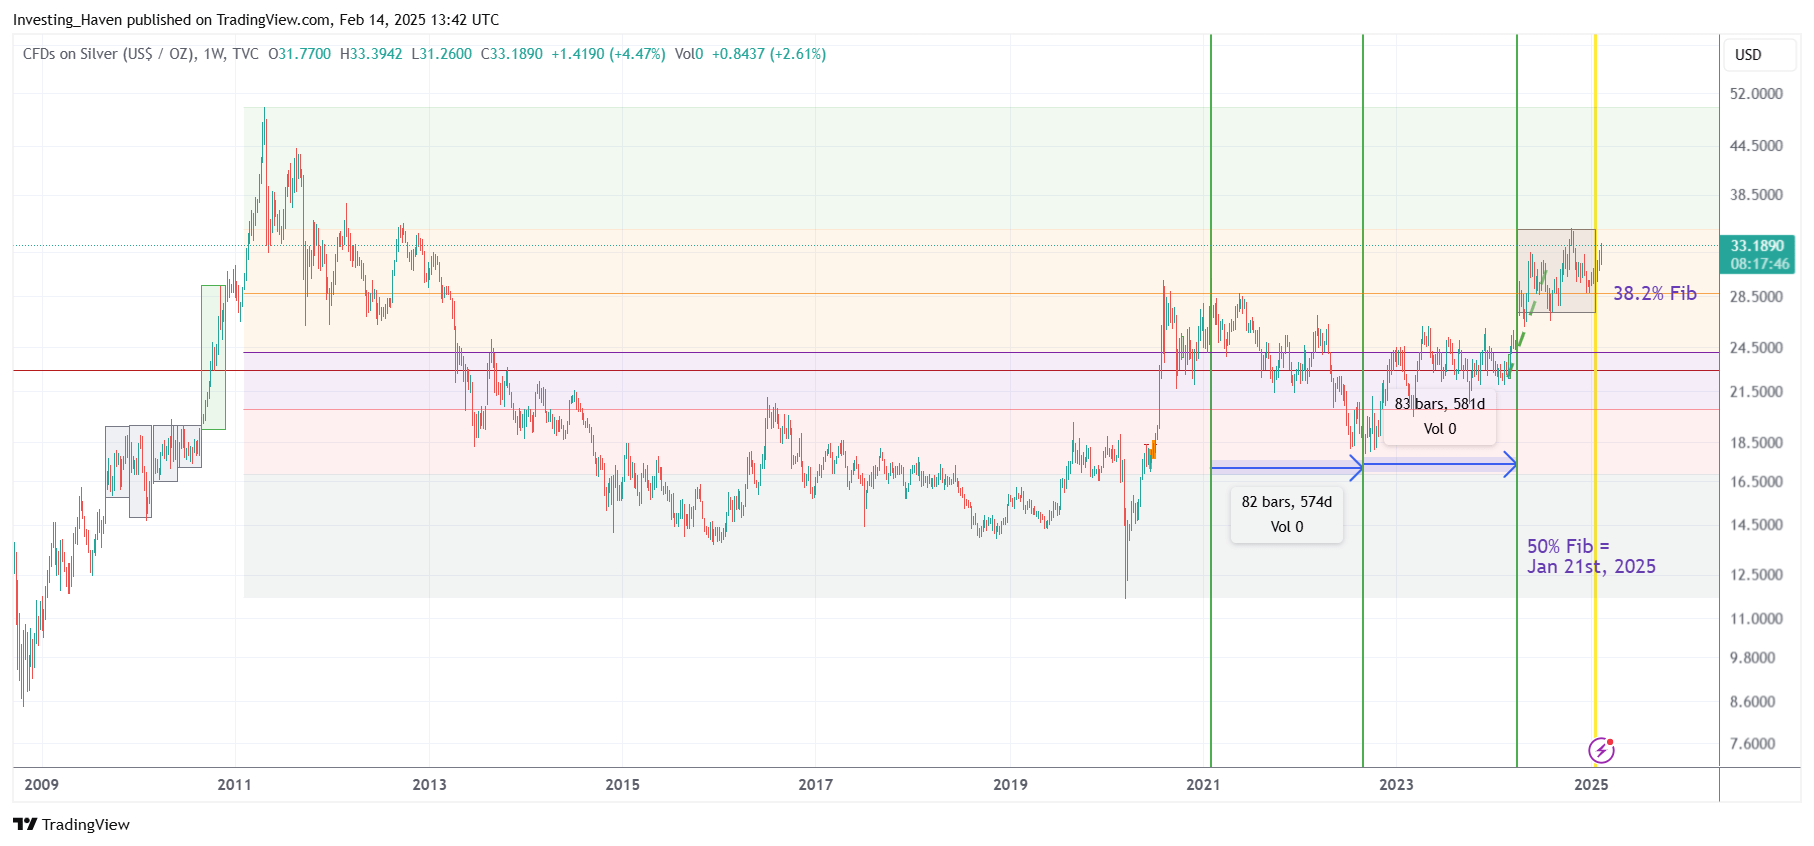
Arguably more importantly is silver’s secular price chart. Remember, chart patterns on the longer timeframes are so much stronger, so better to always consider the secular charts as well.
- Silver dropped exactly to its 38.2% Fib retracement level recently, where it stopped falling, see chart (fine orange line).
- This happened close to an important date: January 21st, 2025. That’s a 50% Fib point on silver’s timeline.
- From resistance to support is the dominant pattern since summer 2020. That’s what silver is doing: from resistance at its 25% Fib level to support at its 38.2% Fib level. This probably means that silver is ready to clear resistance in the not too distant future.
The 3 points above can be easily mapped to the beautiful (awesome and powerful) secular silver price chart shown below.
How will silver develop going forward?
Well, the big moment for silver was in 2013, when it came down a lot, marking the start of a very long term (10 year) reversal.
This reversal is now complete.
What this really means is that there isn’t a lot of resistance going forward.
Indeed, the acceleration point for silver may be here.
While we don’t anticipate a quick move to $50, it might happen.
The point is this – whenever silver accelerates, it will go so fast that investors won’t have time to enter.
Better 2 years too early than 2 weeks too late, is what we believe.


