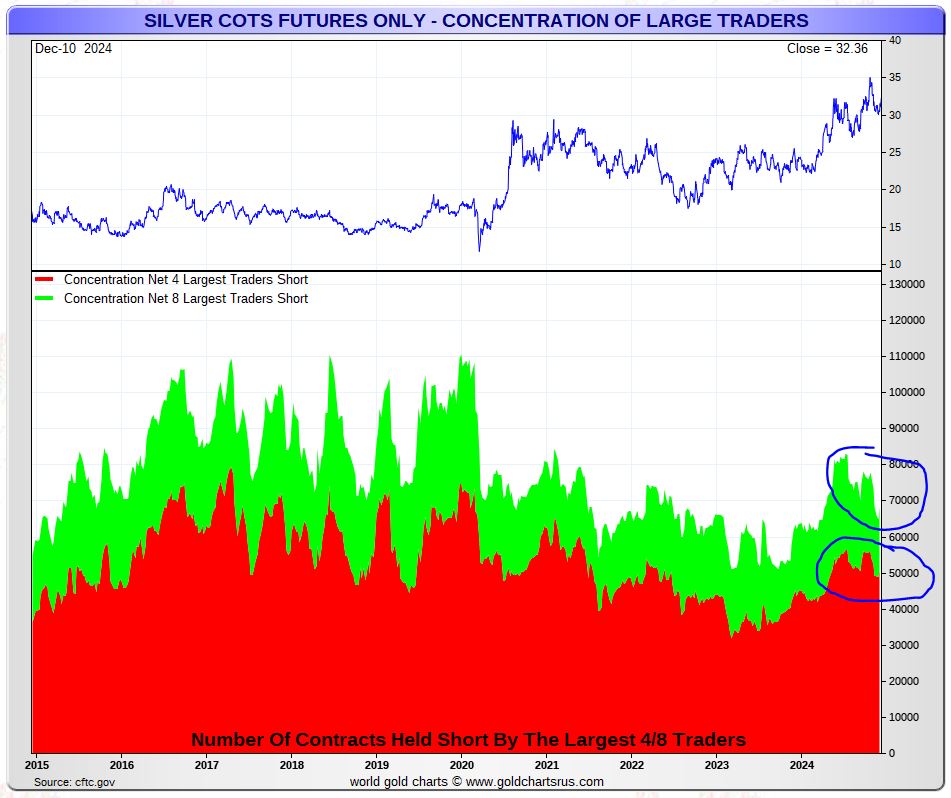
One of silver’s leading indicators is concentration of largest traders positioned short. This data point is well below extremes (chart). What does this mean? Simple, it allows for significant upside potential in the price of silver.
RELATED – When Will Silver Hit $50 An Ounce?
While it pays off to look at silver price charts, for sure the longer term charts like the phenomenal 50-year silver price chart, it is equally important to check the current state of leading indicators.
December 12th – The chart and commentary was updated today.
Silver price leading indicators
Leading indicators are the foundation of our silver price analysis methodology.
The point is this – other markets or data points beyond the silver price chart can help us understand the future path that silver is likely going to follow. Leading indicators include:
- The U.S. Dollar, inversely correlated to silver.
- Yields, inversely correlated to silver.
- COMEX silver market short positioning.
The last point can be split in two parts: net short positions of commercials and concentrated short positions of the largest traders).
This latter can help us understand the upside potential in the price of silver.
Note – We have said it numerous times, we’ll say it again: silver news is not helpful. News is lagging. Case in point: silver news updates like short term focus on inflation data or quarterly price changes are not helpful whatsoever.
Silver price upside potential
As said, within the universe of COMEX silver futures market related data, there is one that helps understand the upside potential in the silver price – the concentration of large traders on the short side of the market.
- The less concentrated the largest traders short, the more upside potential in the price of silver.
- If concentration of the largest traders short is very high, the upside potential in silver is limited.
Below is the most recent chart (courtesy: GoldChartsRUs) when it comes to concentration of the largest traders short in the silver futures market. A few observations:
- Concentration was extremely high back in 2017 – the price of silver was unable to rise.
- Concentration dropped in 2018 and started rising again in 2019 – the silver price followed a similar path.
- In each of these occurrences, the price of silver came down once extremely high levels of concentration were touched.
October 1st – Currently, concentration is nowhere near extremes. In fact, it is pretty low, considering the significant silver price increase between the 2022 lows and 2024 highs. This suggest there is significant upside potential in silver, maybe even massive upside potential, in 2025 and presumably also in 2026.
December 12th – What’s very interesting is the steep drop in concentration of the 8 largest traders short since October 2024. The circle on the next chart highlights our point – the price of silver came down some 14% but the concentrated silver positions dropped significantly. This is a very healthy development because it brings concentration of the largest 4 and 8 traders short to very low levels (a bullish development).

Silver price outlook
In all our recent silver related writings, we confirmed a very bullish outlook for the silver price. The leading indicator shown above is just one of the many data points that confirm silver’s bullish outlook.
READ – When Will Silver Hit 100 USD?
Let’s recap which other data points are bullish:
- Insanely powerful bullish chart pattern on the secular silver chart.
- Leading indicators, especially in silver COMEX, are (strongly) bullish.
- The USD and Yields are supportive.
- Gold is in a strong bull market.
- Silver is tremendously lagging gold, the lagging effect historically has not last for long.
- Silver sentiment is not overly bullish.
- A silver shortage in the physical silver market has been developing since 3 years.
There is plenty of evidence that silver will resolve higher.
Intermarket dynamics confirm it, leading indicator data points confirm it, the lack of excessive bullish sentiment confirms it. How much more evidence do we need to expect a bullish outcome, most likely a wildly bullish outcome?


