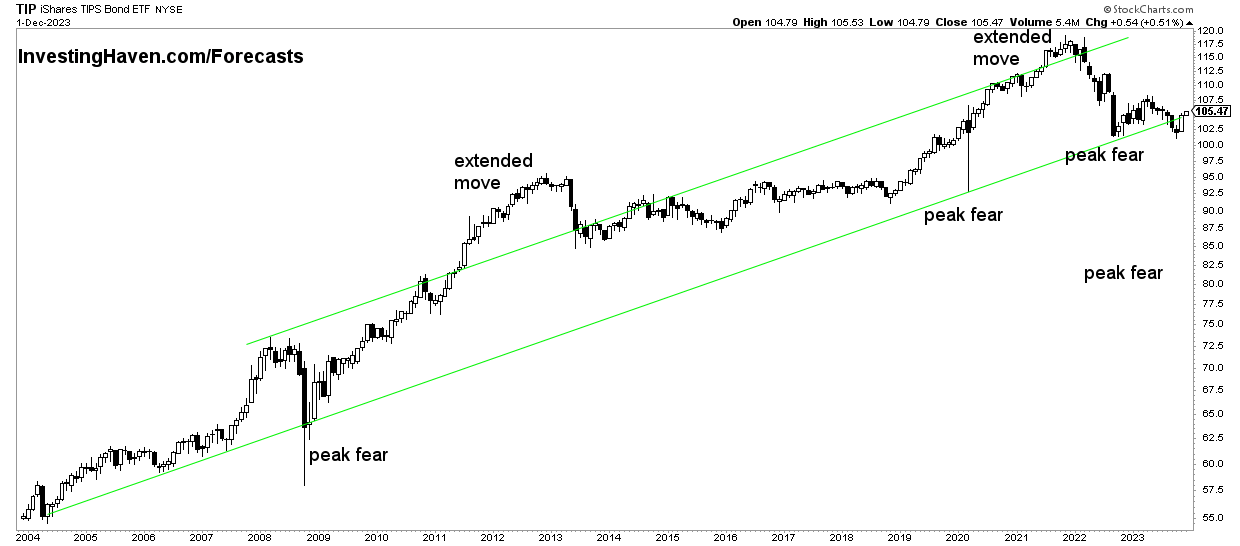
As an investor, it is easy to get lost in a world characterized by information overload. We prefer to keep things simple even though the world is growing increasingly complex. That’s why we identify the single most important indicator(s) every year which alert us on high level trends and potential turning points. The question “which is the single most important indicator for investors in 2024” has a very clear answer: inflation expectations (TIP ETF). This is why, and how, investors should track this indicator in 2024.
Recently, we wrote a detailed article, answering the question how to know whether stocks will tank in 2024.
In it, we said that TIP ETF was the leading indicator that we used to forecast if 2023 would be a make-or-break year for markets.
Similarly, for 2024, we believe inflation expectations will be the leading indicator, for one more year, after which we believe that 2025 will come with another key indicator to track.
Stock Market indicator: simplicity as a response to complexity
Why do we suggest to look at only one indicator?
That’s not exactly what we said.
What we are not saying is that investors should track one and only one indicator.
What we did say, though, is that one indicator can serve a function of a ‘master indicator’ that signals the highest level trend as well as potential turning points.
By focusing on one indicator at the highest level, investors do not have to constantly go through a long list of indicators.
Remember, in our article 7 secrets of successful investing we mentioned this one key for success: “Principles for success are highly asymmetric.”
Talking about asymmetric, it is the basis of what we have defined in our 1/99 Investing Principles.
Those principles are all about the asymmetric nature of markets.
This asymmetric approach should be applied to the information that an investor should track as well as the number of indicators to track.
The Most Important Stock Market Indicator for Investors in 2024
In our article How To Know If Stocks Will Tank In 2024? we explained which two leading indicators would tell us if markets would crash or not, in 2024. It was TIP ETF and VIXY.
From those two indicators, it really is TIP ETF that is the ‘king of all indicators’, in our humble view.
That’s because TIP ETF represents the expected rate of inflation. If markets are in a state of balance, there is some mild inflation which the market calculates based on the expected Fed Funds Rate (2-Year Yields) and the current interest rates.
How does this translate to chart patterns?
Very simple, this balanced state is respected if TIP ETF moves in the long term chart pattern. In other words, we don’t want TIP ETF to fall below its 10-year rising channel for more than 3 months.
Commentary from Oct 15th:
We observe a potential double bottom scenario on the monthly TIP ETF chart, with one monthly candle (half-way this month) below the long term rising channel. No damage done, but this situation cannot continue going into 2024. If TIP ETF does not reclaim its rising channel, in Q1/2024, we might see stocks tank in 2024.
Commentary added on Nov 26th:
TIP ETF, a leading indicator for markets and metals, seems to be confirming a double bottom, with a higher low, right at support of its multi-decade rising channel. This bodes very well for markets and metals in the first half of 2026. The level to watch is (a) the 2022 lows as support (b) 112.5 points as resistance.
Peace of mind for investors in 2024
This article is primarily meant to bring some peace of mind to investors in 2024. By limiting the number of indicators, it creates focus.
And we do know that focus leads to peace of mind.
This is important because this current decade, in markets, so far, is characterized by a record number of anomalies.
We explained this in great detail in The New Normal In Markets: ‘Celebrating’ 2 Years Of Historical Anomalies In Markets.
In order to deal with anomalies, we believe there are a few high level tips we can share:
- Investors have to acknowledge the dual nature of the current market cycle, one that started in 2020 with the spectacular market crash. Since then, every year had dual dynamics in a way never seen before. Just one of the many illustrations was the duality that we witnessed in 2021: stock indexes kept on rising while 90% of stocks were crashing.
- Be patient. Case in point: our silver forecast. Many gave up on silver, as evidenced by the data that we retrieved deep inside the silver market. This is a detailed report sent to premium members one day before the big uptrend in silver started [Silver] Peak Disappointment Is Here, The Market Loves It, It’s Anecdotal Evidence of a Turnaround. As expected, the majority got it wrong. By simply waiting, doing nothing, accepting that the silver market would shrug off all bulls before (which is the most obvious thing the market would do), relaxing, investors would book the best results, long term, both mentally and financially.
- Diversify but do not over-diversify.
As a team, we worked out a solution for point #3 diversification: a passive income service that is delivering a few % portfolio growth, per month, consistently, compounding profits over a long period of time, to realize 10x portfolio growth over a period of 7 years, in full auto-trading mode.


