Is this a gold price bottom or is the price of gold moving towards $1000 in line with our gold price forecast 2017?
It is getting interesting in the gold market. Readers are asking us whether we believe gold has bottomed, because it retraced some 15 pct. from its August top. While that could be true, it is no guarantee for any future price movement.
Although we have forecasted a bearish 2017, it is important to continue on monitoring the trend of the market, and not stick to a forecast made in the past. More specifically, we look at three indicators for a confirmation or invalidation of our bearish gold price forecast.
Gold price chart and pattern does not show signs of a bottom
First, the gold price chart structure suggest more selling will follow soon. At this point, the price of gold is nowhere near any support area. On the contrary, the gold price has entered its bearish trend channel. This suggests more selling towards (or even below) $1000.
Risk indicators are in favor of ‘risk on’ assets
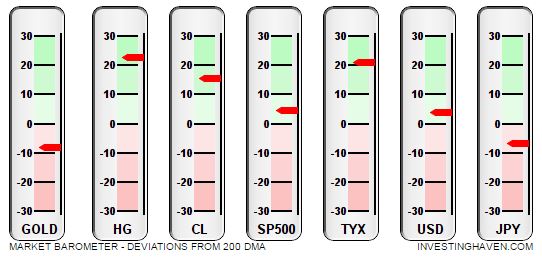
The second data point is our proper market barometer. It looks at the bullish vs bearish state of 7 leading assets. Hence, it is also useful as a risk indicator.
As clearly shown below, fear assets are not performing well. Look at gold and the Japanese Yen; both are in a bearish state. On the other hand, risk assets like High Yield Bonds (HG) and stocks (S&P500) are in a bullish state. In a ‘risk on’ environment, gold is not expected to perform well.

Gold Futures (COT) do not suggest a gold price bottom
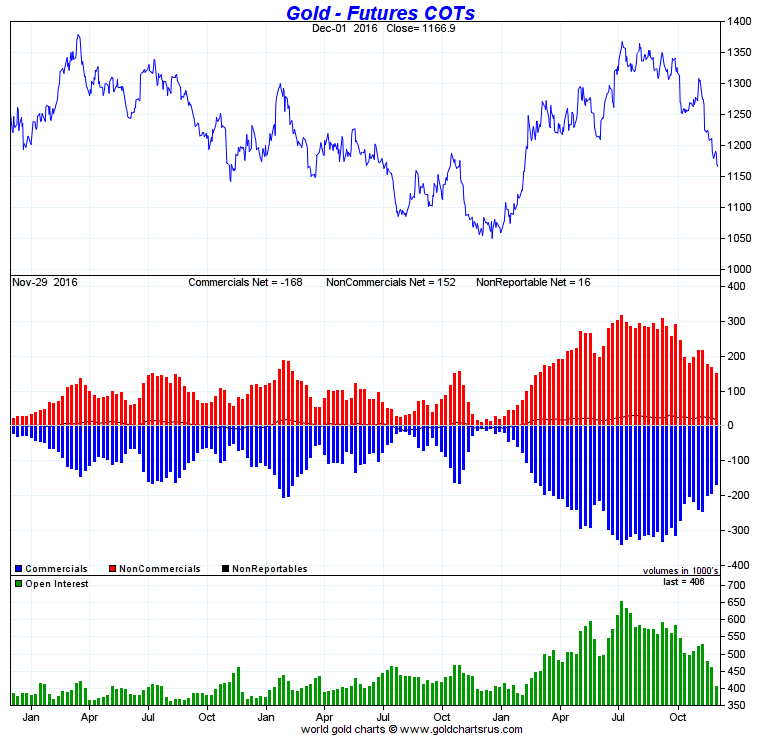
Third, the futures market (COT) is sending a bearish signal. Now here it becomes interesting, as most analysts have different interpretations of this data point.
The Commitment of Traders report (COT) shows the position of futures traders in the gold market. The way to look at this chart is as follows: extremely low or high positions by traders (blue and red bars) coincide with tops and bottoms. At the same time, those positions move from extremely low to extremely high. With that in mind, you should look at what happened in July of this year: positions peaked right at a time when gold reached a very important trendline (see first chart above). THAT is the way to read this chart, i.e. in conjunction with our gold price chart patterns (first chart).
Although positions of traders have come down considerably since August, there is still a long way to go until they reach an extremely low position. Until then, prices will go down.
Interestingly, the three most important data points we consider in forecast the gold price are all confirming a bearish outlook. Now that is both good and bad news for gold investors. The bad news is that selling is not over at this point. The good news is that gold bulls can prepare their shopping list, as they can purchase more of their favorite asset at discounted prices in 2017. We are preparing our wishlist with gold investments, that’s for sure.


