One question top of mind of investors is whether gold (GOLD) will be the beneficiary of the market volatility we forecast in April of 2019. If so, it is time to buy gold and especially the best gold stocks as well as silver stocks. The only cryptic though accurate answer is that volatility may or may not push gold prices higher. The safer approach is to look at gold’s leading indicators described in our gold forecast and assess the probability of a gold price rise, combined with the long term gold charts.
Our point of view is simple, and we really want to bring this point home. Intermarket dynamics as per our 100 investing tips are crucial and help us in forecasting markets, but they only work if and when they work.
In other words, stock market volatility is not going to push gold prices higher per se. It may happen, it may also not happen.
The point is this: history has not shown consistently higher gold prices with higher market volatility. It really hasn’t.
That’s why it is really tricky to simply bet on a safe haven like gold when there are clear signs of rising uncertainty and volatility in markets. Even Forbes noticed this during last year’s volatility.
Gold’s Leading Indicators
It is a much wiser approach to focus on the chart and the leading indicators of gold.
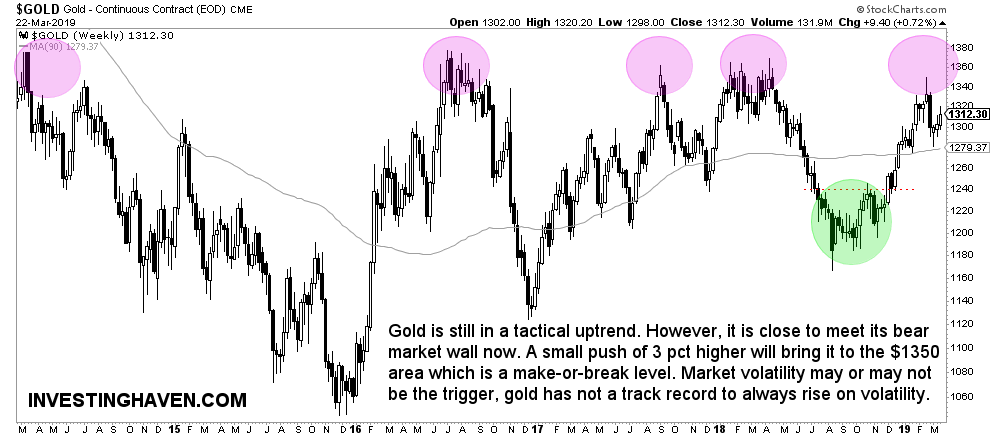
First, gold’s price chart.
There isn’t anything particular to note that we did not point out yet. Especially in our article gold prepares 6th attempt to break its stubborn bear market wall we made the point that the $1375 area is THE most important area to break before gold can get somehow bullish.
The only observation is that we need a rise of another 3 pct before gold tests its bear market wall. The likelihood of this to happen is high, however the real deal is what is going to happen at $1375.

As volatility is no gold leading indicator, and as gold’s chart does not reveal any new insight, we have to turn to gold’s real leading indicators: rates, gold’s futures market and the Euro.
One of the leading indicators is rates. That’s because of gold’s relationship with inflation. Falling rates should be supportive of net inflation. However, inflation indicators are falling with rates this week, so we cannot deduct any significant correlation from this.
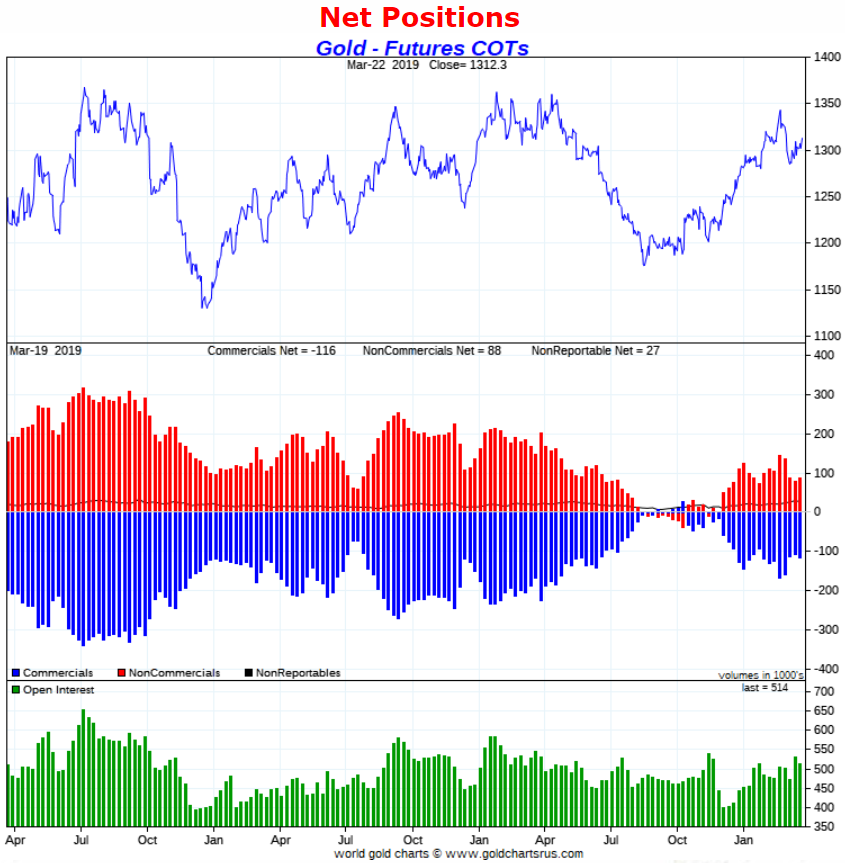
The other leading indicator is gold’s futures market. It is especially extreme positions of futures market participants which are shown in the center pane below that are good at suggesting a major top or bottom for gold’s price.
Right now, we do not see an extreme position. This indicator suggests there is upside potential in gold. However, it is not a given, and it is not a timing indicator. So we have to be prudent interpreting the current positions of this leading indicator.

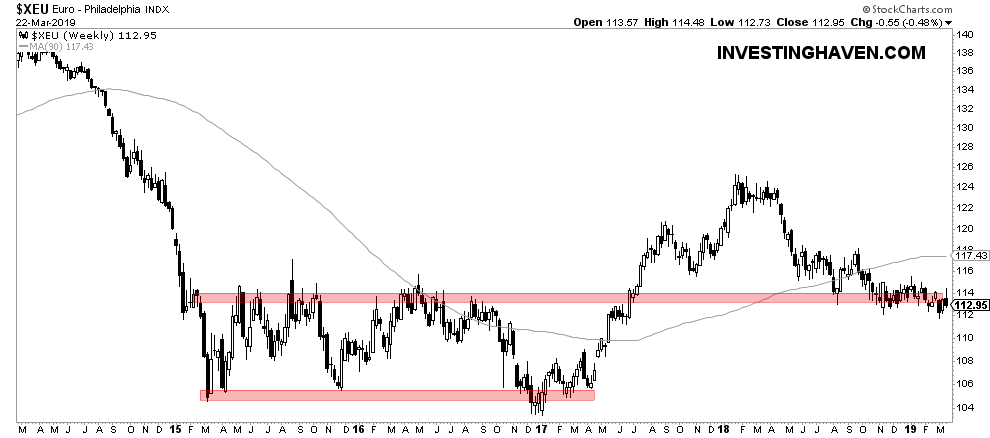
Last but not least, a rising Euro is supportive of higher gold prices. On the weekly Euro price chart we only see some sort of consolidation of the Euro. Nothing points to higher Euro prices at this point in time.

Conclusion: gold’s leading indicators are neutral
The truth about the gold’s market situation is that it will not necessarily become bullish just because of the fact there is market volatility. It may happen, it may not happen, there is no direct correlation per se.
The leading indicators of gold as well as gold’s price chart are supportive of higher gold prices. Stated differently, they are not necessarily suggesting gold will decline.
This leaves us with one and only one conclusion: gold’s price action is the only ‘indicator’ to watch. Only if gold rises to $1375, and breaks through it, will we know for sure that a serious rally will follow.
Sounds simple? It really is simple. Sometimes, things are ultra simple in markets. It is a matter of identifying when they are, and when not.


