Investing Haven
No Result
View All Result
Gold Silver Investing >>
CRYPTO INVESTING >>
  • 2025 Forecasts
    • 10 market predictions
    • Dow Jones forecast
    • S&P 500 forecast 2025
    • Nasdaq prediction 2025
    • Best altcoins to buy
    • Best crypto to buy now
    • Which crypto will explode
    • 15 crypto forecasts 2025
    • Which precious metal to buy
  • Silver
    • Silver prediction 2025 – 2030
    • Will silver exceed $30?
    • When will silver hit $50?
    • Can silver hit $100?
    • Silver shortage
    • 50-year silver chart
    • Silver bullish reversal
    • Silver seasonality charts
    • How to invest in silver
  • Gold
    • Gold prediction 2025 – 2030
    • Will gold set new ATH?
    • Will gold hit $3,000?
    • Can gold hit $10,000?
    • Gold chart 10 years
    • Gold chart 50 years
    • Gold chart 100 years
    • Gold silver ratio
    • Gold seasonality charts
  • Commodities
    • Coffee forecasts
    • Sugar forecasts
    • Nickel forecasts
    • Lithium investing
  • Crypto forecasts
    • BTC prediction 2025 – 2030
    • ETH prediction 2025 – 2030
    • SOL prediction 2025 – 2030
    • XRP prediction 2025 – 2030
    • XLM prediction 2025 – 2030
    • BNB prediction 2025 – 2030
    • ADA prediction 2025 – 2030
    • AVAX prediction 2025 – 2030
    • KAS prediction 2025 – 2030
    • NEAR prediction 2025 – 2030
    • BCH prediction 2025 – 2030
    • LINK prediction 2025 – 2030
    • DOT prediction 2025 – 2030
    • SUI prediction 2025 – 2030
    • ICP prediction 2025 – 2030
    • LTC prediction 2025 – 2026
    • STX prediction 2025 – 2030
    • DOGE prediction 2025 – 2030
    • SHIB prediction 2025 – 2030
    • PEPE prediction 2025 – 2030
    • FLOKI prediction 2025 – 2030
    • WIF prediction 2025 – 2030
    • ONDO prediction 2025 – 2030
  • News
    • Crypto news
    • Commodities
  • Login
Investing Haven
No Result
View All Result

Home » Markets & Stocks » Volatility Back, What’s The Deal? It’s The Rates, Stupid!

Volatility Back, What’s The Deal? It’s The Rates, Stupid!

Taki Tsaklanos by Taki Tsaklanos
March 24, 2019
in Markets & Stocks
volatility
2k
VIEWS
Share on FacebookShare on Twitter

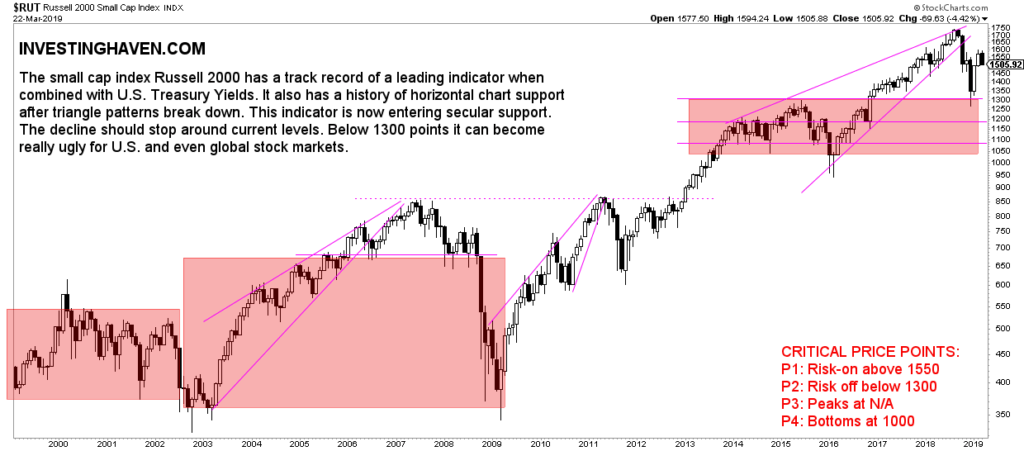
On Friday, stock markets went sharply lower in a way they have not done since end of last year. The Russell 2000, one of our 15 leading indicators, lost 3.6 pct which is a red flag! What’s the deal? Forget about the news, it is not going to add value, as per our investing tips. The interest rates is where it all starts. The chart of the rates is key, and only that one deserves your time! It suggests more volatility ahead, it does not suggest a stock market crash in 2019 (yet).

Intuitively, as markets go deep in red like they did on Friday, investors start looking for the news. As expected the news is … the news.

Stock Market Rally Trips on Global Growth Fears (WSJ)
Why stock market investors should worry about a bearish divergence in financials (MarketWatch)
How Far Could The Stock Market Drop? Will These Support Levels Hold? (Forbes)
Stocks End Week Lower Amid Hints of Slowing Growth: Markets Wrap (Bloomberg)

Alright, so there is clearly signs of slowing growth (not good) as well as bearish divergences (not good neither).

Where does this leave us, investors?

No idea, economic data are not good.

But wait a second just one month ago financial media were talking about the historic rally of Jan and Feb 2019. So things looked great a month ago, and now not any longer?

It’s the interest rate, stupid!

As said over and over again, stop reading news. As per Tsaklanos his 1/99 Investing Principles, the financial market variant on the generic Pareto’s law, just 1% of the news is relevant for investors.

Let’s turn our attention to the charts and focus on leading indicators.

Any turmoil in markets starts in currency and credit markets.

The 10-year rate is the key chart to watch. The annotations on our chart (in red) make the point: rates were not able to cross 30 points. They are now in this twilight zone: the 20 to 25 area. It is above the falling channel that connects the 2007 peak with the one in 2014 and 2017, most of them turning points for markets.

rates

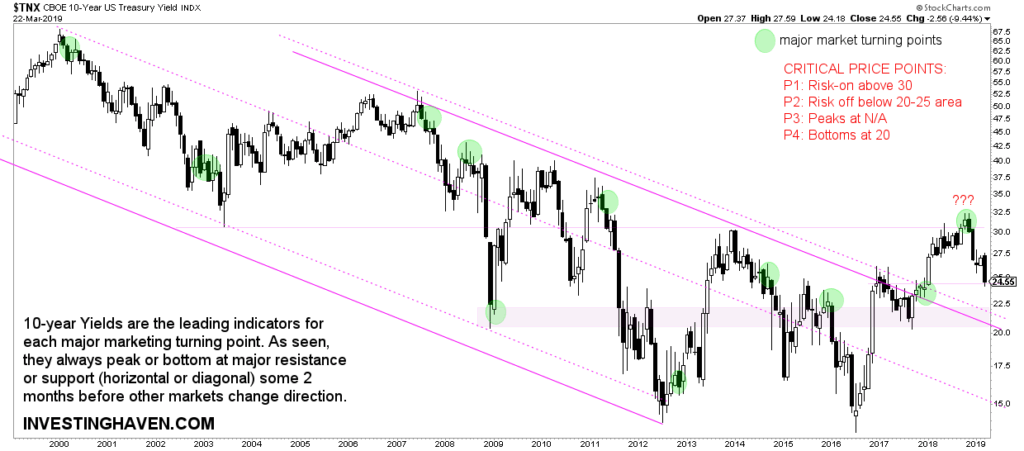
Is this chart suggesting a stock market crash is imminent? No, at least not yet. We expect a fast decline to the 20 to 22 point area. This will lead to more volatility in global markets. So April will be a volatile month, it’s almost a given!

However, a fast decline below 20 points will be really bad provided it comes with major breakdowns in stock market indices.

We are far from that point.

Bonds: Capital Inflow Sucks Money Out of Stock Markets

Markets are a closed system.

Capital moves from one asset class to another one. As rates decline, see chart above, capital moves to Treasuries, out of stocks.

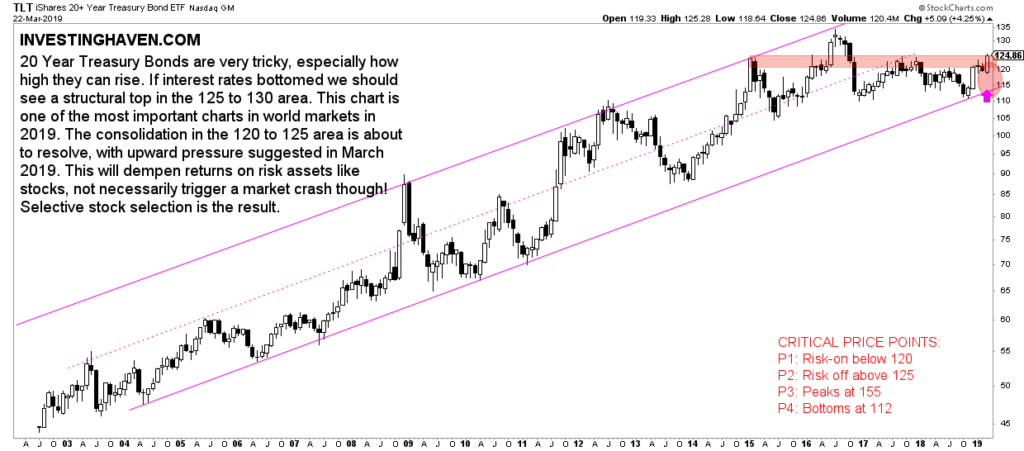
That’s what the TLT ETF chart as well as the Russell 2000 charts below show.

The TLT ETF, a measure for interest in Treasuries, is attempting to move above 125 points, after 4 years.

This brakout, if and when confirmed, certainly will suck money into Treasuries, out of stocks.

treasuries

The Russell 2000 shows that money indeed starts flowing out of stocks after a great rally in Jan and Feb 2019. The Russell 2000 has another 200 points to fall before it will flash a real warning signal. Below 1300 points it might test 1050 in the worst case scenario. We are far from that point, no reason to be overly concerned.

The key message of the last 2 charts is this: as Treasuries will attract capital there will be an outflow out of stocks. It will dempen returns on stocks in the next few months. It will not lead to a crash per se.

Being selective in the stock market is key. And investing in utility stocks is the way to play the short term trend as said in our article published earlier today Investing Tips To Play The Volatility In April of 2019.

stocks
10-YEAR ANNIVERSARY OFFER: InvestingHaven.com celebrates 10 years. Temporarily, you can enjoy a discount on our premium gold/silver and crypto reports. Or you can become a VIP member. Go to our anniversary deals >>
Receive our weekly newsletter.

premium service SP-500 premium service trade alerts premium service crypto teaser 

No related posts.

Tags: TNX
Taki Tsaklanos

Taki Tsaklanos

Taki has +15 years of experience in global markets. He is passionate about forecasting markets - he calls it THE ART OF FORECASTING. His analysis methodology is unique and effective, yet easy to understand; it is based on chart analysis combined with intermarket / fundamental / sentiment analysis. His work appeared on major financial outlets like FinancialSense, MarketWatch,Twitter: twitter.com/investinghaven

Connect with InvestingHaven

Receive top notch forecasts for free.

*We hate spam as you do.

Site Navigation

  • RSS Feed
  • About us
  • Advertising
  • Sponsored Content Policy
  • Mission 2026
  • Sitemap
  • Privacy & Disclaimer
  • Terms of Service
  • Contact Us
investing haven logo

Precious metals market analysis including gold and silver price predictions. Crypto market analysis including highly accurate BTC ETH SOL XRP forecasts.

Copyright © 2025 InvestingHaven

Login to your account below

Forgotten Password?

Fill the forms bellow to register

All fields are required. Log In

Retrieve your password

Please enter your username or email address to reset your password.

Log In

Receive top notch forecasts for free.

*We hate spam as you do.

No Result
View All Result
  • News
  • 2025 Forecasts
    • 10 market predictions
    • Dow Jones forecast 2025
    • S&P 500 forecast 2025
    • Nasdaq prediction 2025
    • Best crypto to buy now
    • Which crypto will explode
    • Best altcoins to buy
    • 15 crypto forecasts 2025
    • Which precious metal to buy
  • Silver articles
    • Silver prediction 2025 – 2030
    • Will silver exceed $30?
    • When will silver hit $50?
    • Can silver hit $100?
    • Silver shortage
    • 50-year silver chart
    • Silver bullish reversal
    • Silver seasonality charts
    • How to invest in silver
  • Gold
    • Gold prediction 2025 – 2030
    • Will gold set new ATH?
    • Will gold hit $3,000?
    • Can gold hit $10,000?
    • Gold chart 10 years
    • Gold chart 50 years
    • Gold chart 100 years
    • Gold silver ratio
    • Gold seasonality charts
  • Commodities
    • Sugar forecasts
    • Coffee forecasts
    • Nickel forecasts
    • Lithium investing
  • Crypto news
  • Crypto forecasts
    • BTC prediction 2025 – 2030
    • ETH prediction 2025 – 2030
    • SOL prediction 2025 – 2030
    • XRP prediction 2025 – 2030
    • XLM prediction 2025 – 2030
    • BNB prediction 2025 – 2030
    • ADA prediction 2025 – 2030
    • AVAX prediction 2025 – 2030
    • KAS prediction 2025 – 2030
    • NEAR prediction 2025 – 2030
    • BCH prediction 2025 – 2030
    • LINK prediction 2025 – 2030
    • DOT prediction 2025 – 2030
    • SUI prediction 2025 – 2030
    • ICP prediction 2025 – 2030
    • LTC prediction 2025 – 2026
    • STX prediction 2025 – 2030
    • DOGE prediction 2025 – 2030
    • SHIB prediction 2025 – 2030
    • PEPE prediction 2025 – 2030
    • FLOKI prediction 2025 – 2030
    • WIF prediction 2025 – 2030
    • ONDO prediction 2025 – 2030
  • Premium Crypto Alerts
  • Premium services

Copyright © 2025 InvestingHaven