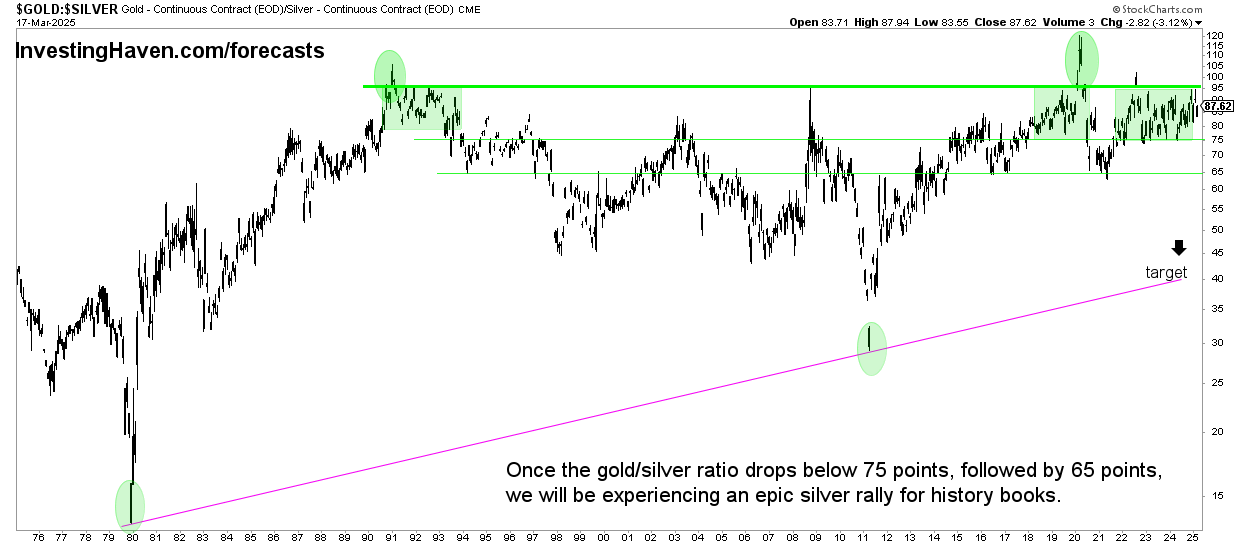
The gold to silver ratio is about to complete a multi-year bearish pattern. This is very, very bullish for the price of silver, particularly in 2025.
We explore a fascinating phenomenon linked to the gold-to-silver ratio. In a natural way, the gold-to-silver ratio chart concludes that silver has the potential to stage epic price swings, from time to time. They tend to result in epic silver rallies that go into history books.
RELATED – Silver price prediction 2025 till 2030
By analyzing historical data and observing the pattern, we notice the potential for significant price movements in silver whenever the ratio drops below the 80 to 100x range.
Understanding the Gold-to-Silver Ratio
The gold-to-silver ratio is a simple metric that compares the price of gold to that of silver. It is calculated by dividing the price of gold per ounce by the price of silver per ounce.
RELATED – Gold price prediction 2025 till 2030
Historically, this ratio has exhibited considerable fluctuations, influenced by various factors, including market sentiment, economic conditions, and supply and demand dynamics.
However, epic turning points have been registered in the 80-100 points area. More importantly, any drop below 80 points came with strong silver price action.
November 2nd – The gold to silver price ratio continues to churn around 80 points. Silver had an amazing opportunity to stage an epic rally, after silver’s breakout in April 2024, pushing the gold to silver ratio to the 75 point area (which is an important decision point for an accelerate move higher in the price of silver). However, the time was not right, the market was not ready for silver to move to ATH.
The Phenomenon of Epic Silver Rallies
Over the past 50 years, the gold-to-silver ratio created a pattern worth analyzing, especially for gold & silver investors:
Every time the gold to silver ratio exits the 80 to 100x range, it consistently started epic rallies in the silver price.
Let’s examine four notable instances when this pattern unfolded: 1991, 2002, 2009, and 2020.
- 1991 – A catalyst for silver’s surge. In 1991, the ratio breached the 80 to 100x range, signaling a major opportunity for investors. Following this event, silver experienced an impressive rally: the price of silver soared in subsequent years. This silver price rally showed the potential for significant returns with silver investing.
- 2002 – Silver’s secular bull run. Another remarkable instance occurred in 2002 when the ratio once again entered the 80 to 100x area. Silver responded with a monumental rally, when the ratio dropped below 80x points. Silver investors who identified this opportunity created tremendous wealth.
- 2009 – Seizing the moment. During the global financial crisis of 2008-2009, the ratio surpassed the 80 to 100x mark, setting the stage for another spectacular silver rally. Amid market uncertainty, investors turned to silver as a safe haven asset, driving up its price significantly.
- 2020 – A modern-day phenomenon. In the wake of the COVID-19 pandemic, the ratio once again went into the 80 to 100x range. As monetary inflation started spiraling out of control, silver experienced a remarkable rally, confirming the pattern observed over the past decades (as explained above). This recent event solidifies the notion that the ratio can serve as a valuable indicator for wild silver price swings.
The Gold-to-Silver Ratio and Historic Silver Rallies
The historical evidence suggests that the gold-to-silver ratio entering the 80 to 100x range may act as a signal for an important turning point in favor of silver. This ratio is not a timing indicator though, a turning point can last months or even quarters.
November 2nd – The gold to silver ratio continues to churn in the 75 to 95 area. However, if you look carefully, you will find a bearish M-pattern which started in 2019, had its mid-point in 2021. This M-pattern is roughly 75% complete. Any M (also W) pattern, whenever it reaches 75% completion, is ready for the last leg. What we are saying is that this ratio is about to resolve, most likely, and resolution is lower in this ratio, consequently higher in spot silver.

Anecdotally, after 3 years of silence about silver’s price, the Wall Street Silver group is tweeting again about silver’s price. Not only that, their focus on a “silver squeeze.” The silver shortage idea was objectively confirmed by Dolly Varden’s CEO with lots of data points.
Gold and silver charts
We have been looking at one specific ratio chart, above: the gold to silver ratio. It also is insightful to check the gold and silver price charts separately against each other.
The pitfall to avoid – picking the right timeframe, certainly do not pick lower timeframes.
Below is an interesting post on X that highlights the longer term gold price chart and silver price charts:
$SILVER is in historical, long-awaited breakout-mode.
With gold´s mega breakout 7 months ago, the PM bull resumed.
Now silver is about to follow gold.
Said for years my minimum price target is 370, and it still is.
There has truthfully never been a bigger opportunity. Or threat. pic.twitter.com/Bs1nSkC9d6— Graddhy – Commodities TA+Cycles July 12, 2024
As seen, silver is lagging gold. This is exactly what the gold to silver ratio chart has been telling us. Silver will need to catch up, which it will do sooner or later. In that scenario, it will fall below 65 points (as outlined above). This will trigger in a silver run to the $48-50 area.
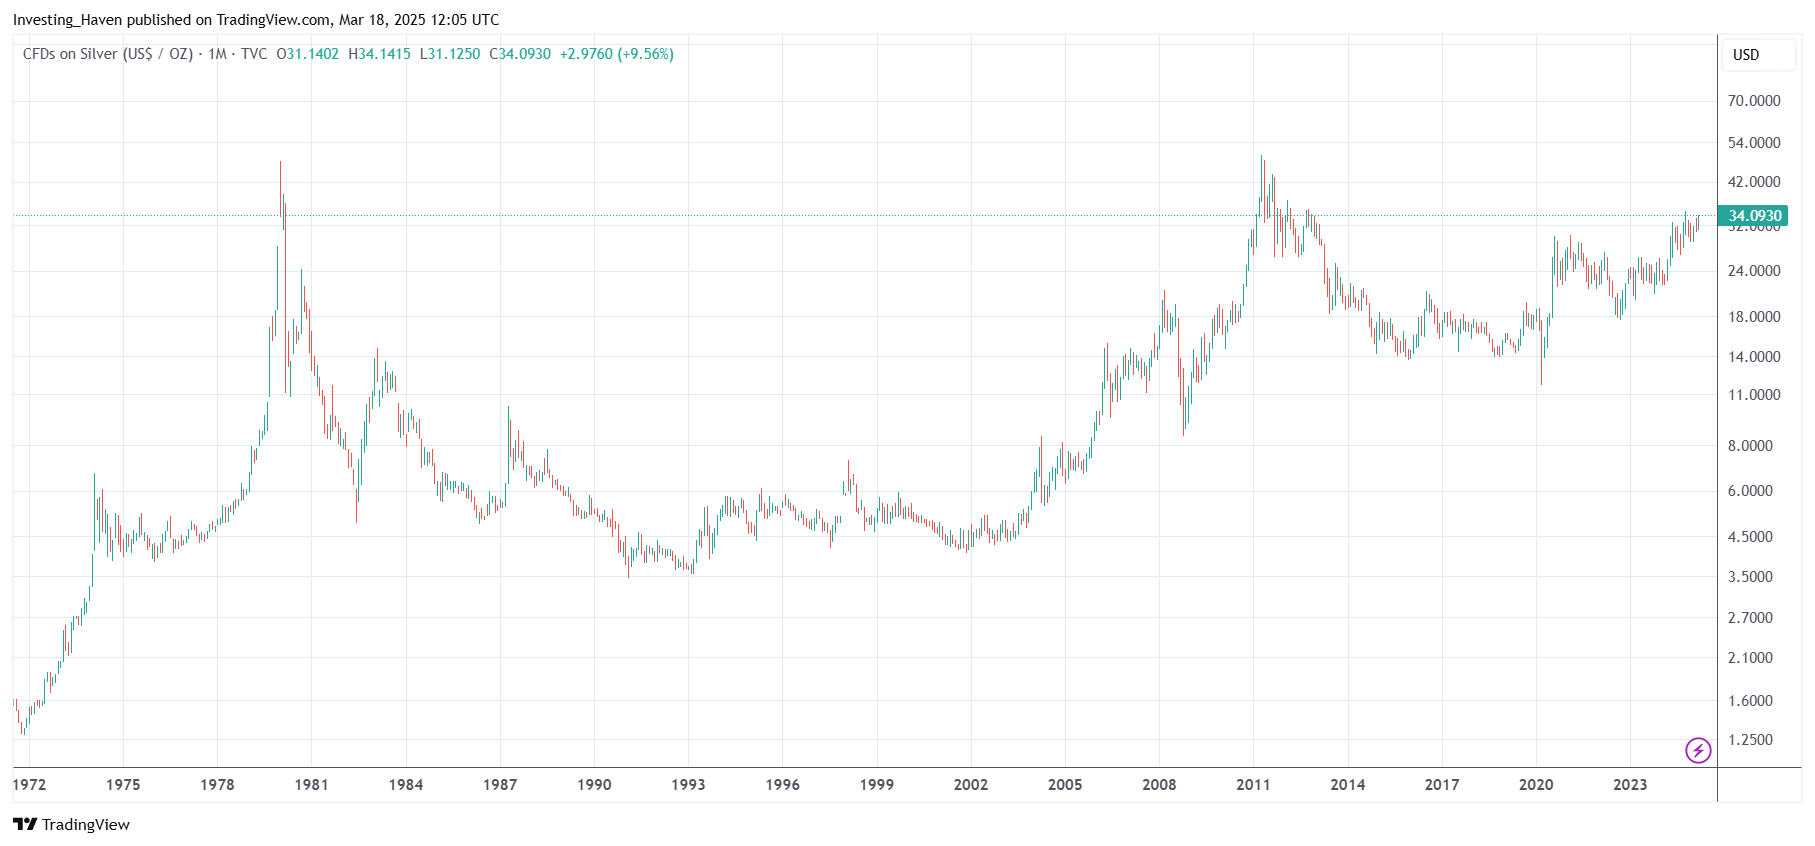
In closing, we include the silver price chart, on its weekly timeframe, without chart annotations. If anything, this pattern is clearly pointing to $50 per Ounce as a target. It is blatantly clear: silver wants to test ATH.

Even if we ignore the gold to silver price ratio, and only focus on the wildly bullish reversal pattern on the long term silver chart, we derive a similar conclusion: silver is eager to move to ATH.
Remember, will creep slowly but surely higher, initially slowly. But then, at a certain point in time, when the accelerated moves higher starts, it will catch everyone by surprise. With this type of chart structure, we expect silver to move ‘in no time’ from 37.70 to 50.75, leaving the majority of investors behind.
Our premium gold & silver market reports cover every week leading indicators of gold price and silver prices. Gold & Silver market reports >>


