Silver, the restless metal, is doing what it’s good at, traditionally: confusing both bulls and bears. While the price chart silver may look scarily bearish there are multiple indicators that suggest silver is really bullish, long term.
The USD is creating havoc. Every time the USD rises markets & metals tend to sell off. The opposite is true as well: any tiny decline of the USD comes with a big moves in markets and metals.
Gold, being one of the leading indicators of silver, is testing multi-year support. The really aggressive stance of the U.S. Fed might push gold lower, much will depend on the reaction of metals and markets on the next Fed interest rate decisions.
However, there are 2 indicators that suggest that silver is long term really bullish. First, the CoT report is one of the indicators that are historically stretched and suggest the downside in silver is really limited compared to the massive upside that silver (any similar CoT readings in the past came with big rallies).
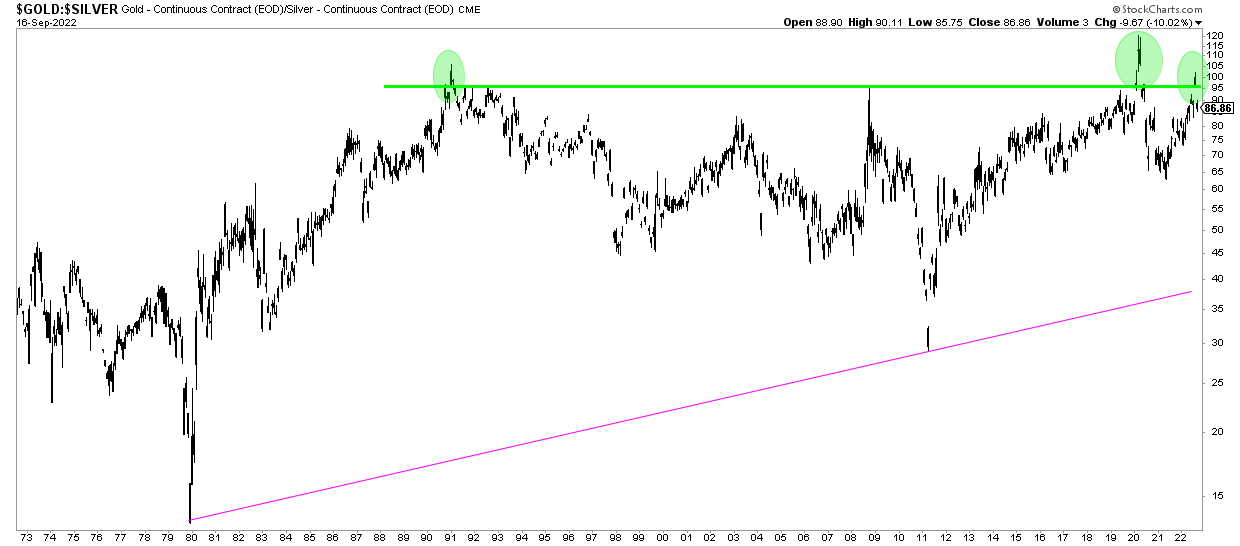
The gold to silver ratio is another indicator that suggests silver is a great long term investment.
We featured the gold to silver ratio a few months ago in Silver Is A Screaming Buy Says This Indicator:
The gold to silver ratio says that silver is a screaming buy: the gold to silver ratio over 50 years! Take a look at the green line: any time, in history, silver achieved a ratio of 92:1 when compared to the price of gold, it started an epic turnaround. In some cases it took a few years, in other cases a few months, for silver to become explosive!
In essence, any readings above or near 100 (gold price : silver price) are long term buy opportunities. It happened 2 times in history, a few weeks ago was the 3d time.
We are confident that silver is a long term buy. Yes, buy the dip is justified (provided no leverage) regardless what happens to precious metals in the next few weeks and months.


