The price of platinum (PLATINUM) showed relative strength in the first months of 2019. Does this reveal any meaningful insight for investors? Does this help in establishing in a platinum price forecast for 2019? Yes, is our answer, as platinum is very close to fire a strong ‘buy’ signal. Once above 900 USD /oz for 3 consecutive months our platinum price forecast for 2019 turns bullish with a first price target of $1190 USD/oz.
Remember, there is always a bull market in one of the 4 precious metals, as noted by InvestingHaven’s research team.
Platinum On The Rise
As palladium seems to be invalidating its bull market, and both gold and silver decided to continue their consolidation, it might be that platinum is preparing a bullish move.
What we ultimately want to know is forecast the 3 TOP investing opportunities each year. Obviously, we want to participate to each one of them, and get in early. That’s the strategy of smart investors, that’s the strategy we pursue and we are committed to achieve this.
The price of platinum is on the rise lately.
Platinum dipped at $780 early this year, and rose to $900 recently. That’s where the rally stalled though.
So the million dollar question we want to solve is whether platinum will rise above $900. That’s because, if it does so, as per the charts embedded below, we believe it will rise fast 32% at a minimum.
Platinum Forecast vs. Platinum Fundamentals
We tend to base ourselves on leading indicators in each and every forecast we publish.
What’s the leading indicator of platinum which may be useful for our platinum price forecast for 2019?
The bad news: there is none.
Platinum is one of the few assets out there that have no real consistent leading indicator. The only leading indicator may be extreme supply or demand changes which happen so exceptionally that investors can hardly rely on them.
Even if we look at what Bloomberg published in what they pretend would be 5 charts suggesting platinum has a bullish forecast. We interpret this as leading indicators. These are the 5 data points from the article:
- The price chart of platinum. The price chart is the daily chart, in no way is this the relevant view, set aside a leading indicator.
- Palladium to platinum ratio. The ratio is in extreme territory in favor of palladium. Again, a ratio that is extreme can become more extreme. No leading indicator, no valid data point.
- Supply cuts. This may become relevant at a certain point, but this is hardly possible to forecast.
- Platinum ETF holdings. As the intransparancy in physical metal holdings underlying ETF’s is so high we do not consider this a reliable forecasting data point.
- Platinum futures market. Now this may be relevant, so let’s look into this.
This is what Bloomberg says on the last point:
Data from the U.S. Commodity Futures Trading Commission also points to positive sentiment on platinum. Hedge funds have held a net-long position since the week ended Feb. 26. The bullish platinum bets reached a one-year high in late March, although the net-long position pulled back somewhat in the most recent data.
Unfortunately, our viewpoint is the opposite. Once hedge funds have extreme long positions it tends to be the ultimate contrarian indicator. Hedge funds follow Tsaklanos his 1/99 Investing Principles: just 1% of them is really successful. So when they all move in the same direction the opposite is likely to happen.
Platinum Price Forecast 2019: Base Case
The above analysis leaves us with one and just one data point for our platinum price forecast 2019: the platinum price chart. We actively look for price patterns and trends.
Our monthly platinum charts are very useful in identifying price trends. Interestingly, we see 2 major trends based on 2 different patterns.
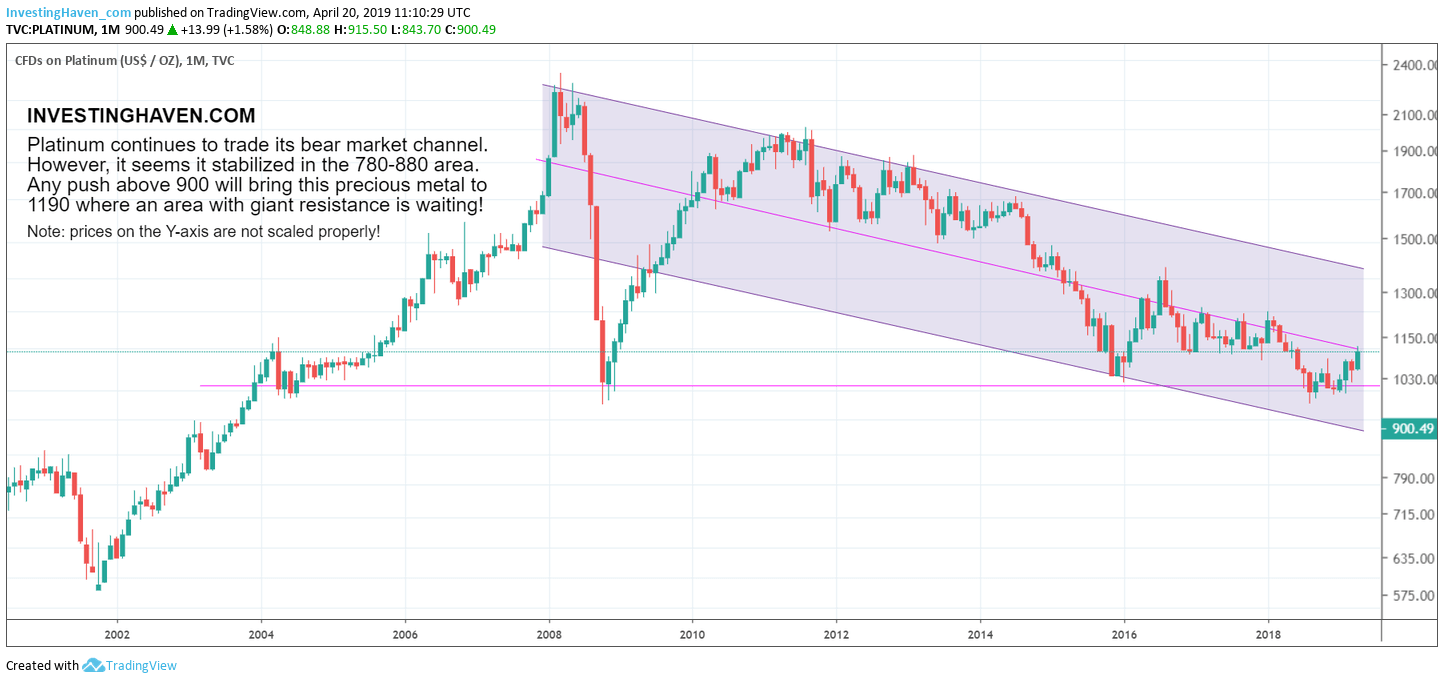
The first pattern is the falling channel. It is a symmetric channel as seen below.
The trendline which runs in parallel with the median line is the important one for our platinum price forecast 2019. It shows that platinum now trades exactly at in-channel resistance.
This also implies according to us that once above the current trendline (900 USD /oz) platinum is likely going to attempt to rise to resistance at 1190 USD /oz. This may happen towards the end of 2019.
This is our base case platinum price forecast 2019.
Platinum Price Forecast 2019: Bullish Case
As said above, we see 2 major trends based on 2 different patterns.
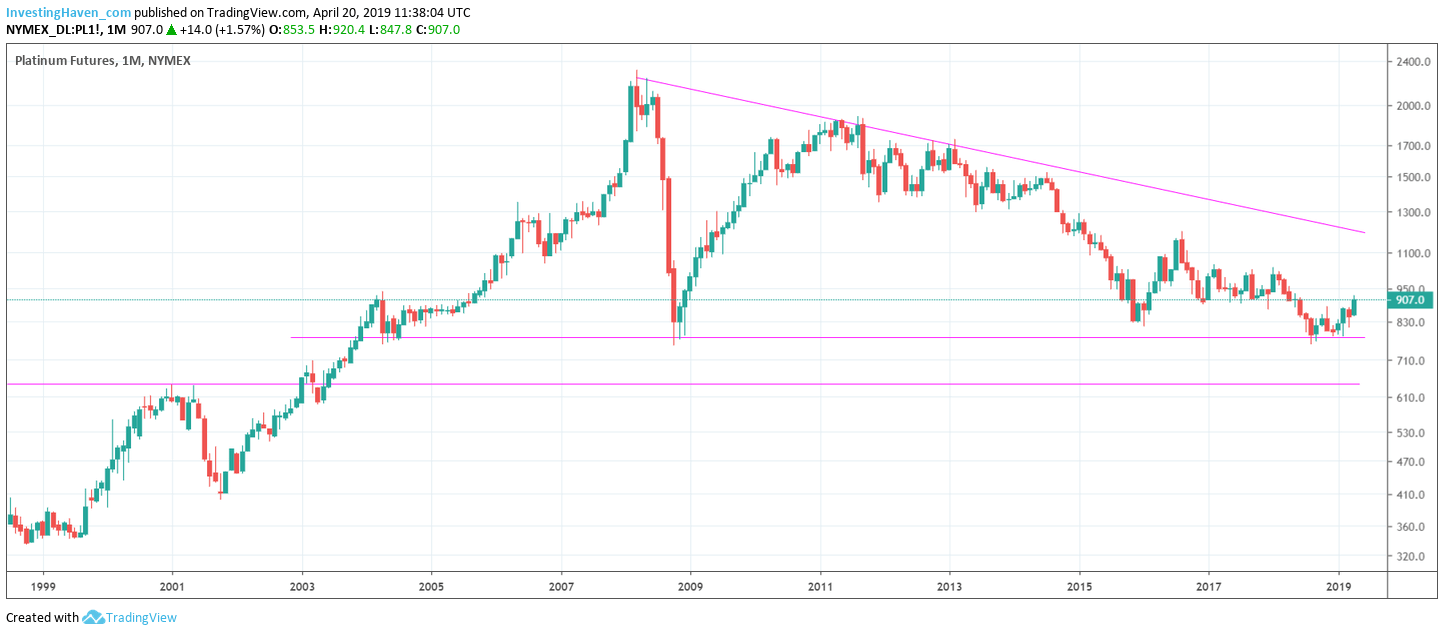
The second pattern is a giant triangle as seen below.
The 3 touches with support took place in 2008, 2016 and early 2019. Even before, in 2004, there was a touch of support.
The key take-away from this pattern is, interestingly, the same as the falling channel shown in the above platinum chart. This triangle pattern has the same resistance which is $1190 USD/oz.
If and when platinum decides to move out of this triangle, and break out of it to the upside, we will see a monster bull market. This certainly will not happen in 2019 unless exceptional circumstances like acute supply shortages will occur. Not likely, but never say happen.
Beyond 2019 though there is a probability that a platinum bull market will start. The most bullish price target becomes $1800 but that’s certainly not a realistic price target in 2019.