Platinum price seasonality has outspoken cycles and dynamics. These 5 platinum seasonality charts learn that March/April as well as December are consistently strong months. Will 2024 show a year-end really consistent with previous years? There is one concern in 2024…
RELATED – A Platinum Price Prediction For 2025
By analyzing historical data and recent performance, one can identify key months for potential gains and periods where caution is warranted.
In this article, we analyze the seasonality of platinum prices using several charts that cover different time frames, from the long-term 50-year trends to the recent years.
Additionally, we compare platinum’s seasonality with silver to provide a broader context for precious metals investors.
Platinum price seasonality: a 50-year chart
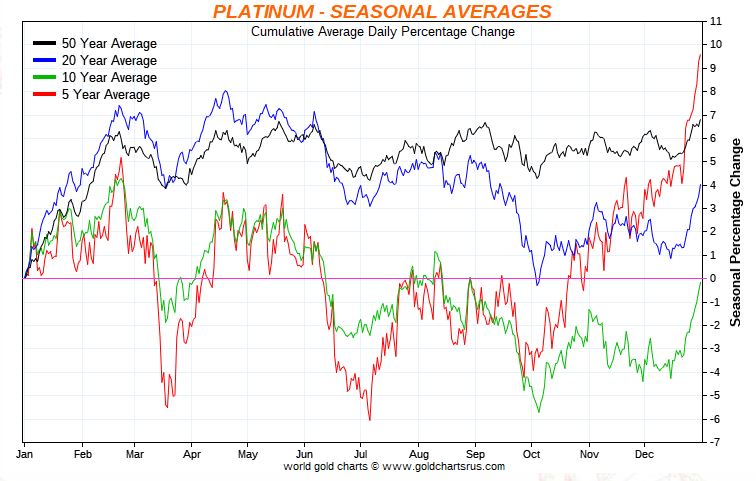
The 50-year platinum price seasonality chart provides an extensive historical perspective, highlighting average price trends throughout the year.
- Strong early year performance: The data shows a strong rise in platinum prices from January to around late February or early March, suggesting that this period often sees increased demand or favorable market conditions.
- Mid-year weakness: A decline is evident from March onward, reaching its lowest point around mid-year (June to July). This suggests a typical correction or reduced demand during this period.
- Late year rally: From July onwards, prices generally recover, peaking around September and fluctuating but remaining relatively strong through the end of the year.
Revealed insights: The long-term seasonality suggests two main periods for potential gains—early in the year (January to March) and later in the year (July to September). The mid-year period often indicates caution or consolidation.
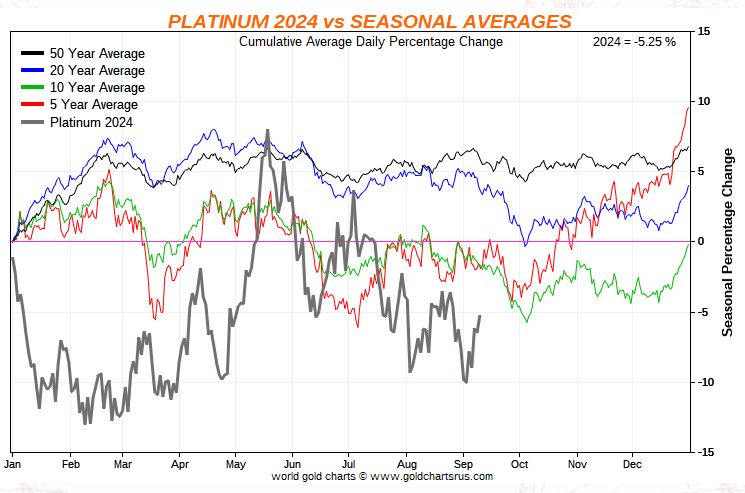
This chart compares the 50-year average seasonality with the specific performance of platinum in 2024.
- Early year divergence: In 2024, platinum experienced a significant dip in January and February, a notable divergence from the 50-year average that typically shows strength in these months. This deviation may signal caution for a bullish trend in early 2025.
- Consistency later in the year: The rest of 2024 aligns more closely with the 50-year trend, with a recovery starting in mid-year and continuing through the end of the year.
- Potential bearish signal: The early-year dip in 2024 suggests that platinum might not be ready to enter a bullish phase in the short term, potentially extending this outlook into early 2025.
Revealed Insights: The sharp divergence early in 2024 highlights potential market-specific factors affecting platinum prices, diverging from historical trends. This requires investors to be cautious about relying solely on seasonality for early 2025 predictions.
Platinum price seasonality since 2020
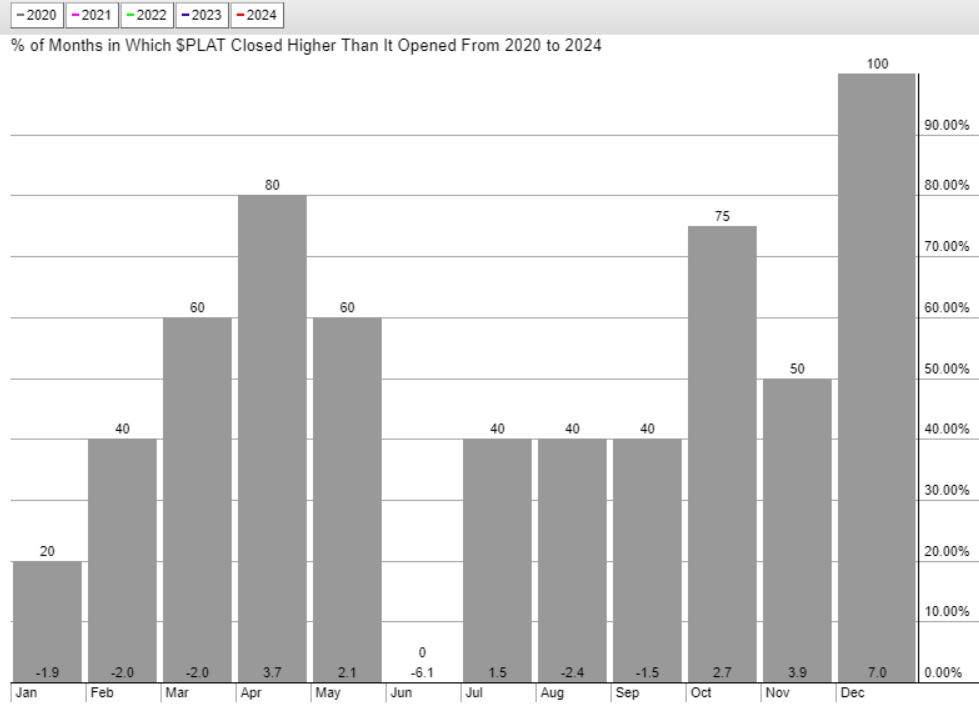
This chart illustrates platinum’s monthly performance from 2020 to 2024, showing the percentage of months when platinum closed higher than it opened.
- Consistent peaks in March/April and December: The chart indicates consistent peaks in March/April and December, suggesting strong seasonality for these months.
- Weaker performance in mid-year: The middle months do not show significant strength, indicating potential periods of consolidation or reduced activity.
Revealed insights: The recent 4-year period confirms strong performance in March/April and December. These months could present reliable opportunities for gains, aligning partially with the long-term trends and highlighting their importance for traders.
Platinum price seasonality since 2005
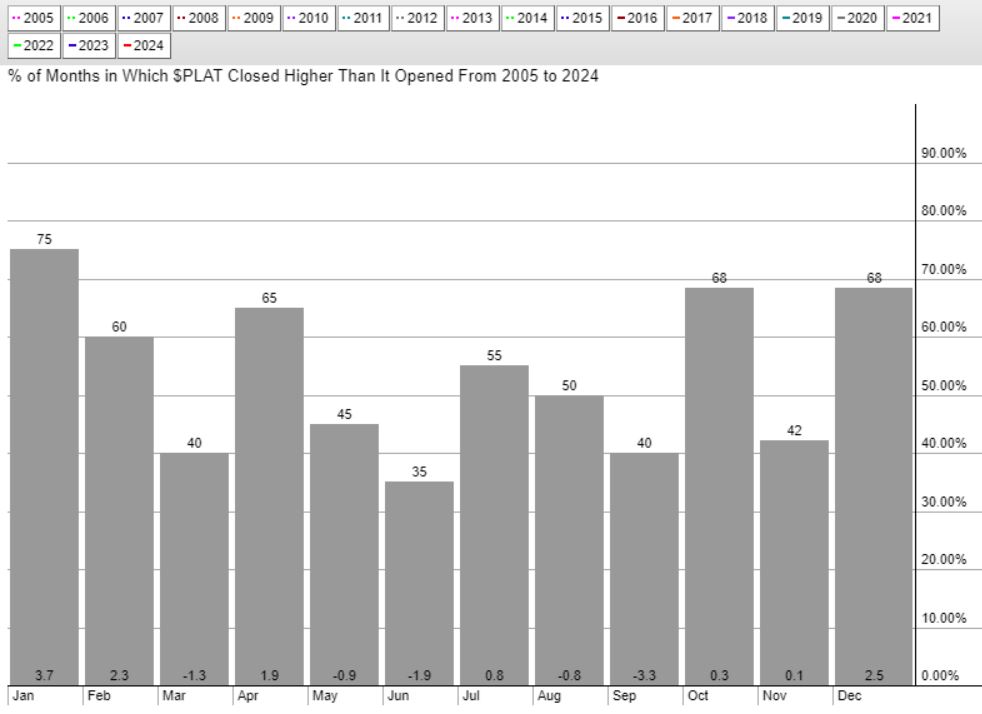
Covering the 19-year period from 2005 to 2024, this chart provides a longer-term perspective on platinum’s seasonality.
- Good months – January, April, October, and December: These months show consistent positive returns, suggesting they are strong periods for platinum investment.
- Variable performance in other months: Other months, like June and July, have more mixed results, reflecting variability and a need for careful market analysis.
Revealed Insights: The extended period from 2005 to 2024 aligns with some of the 50-year trends but shows more variability. This underlines the importance of focusing on strong months (January, April, October, December) for potential gains while being cautious during mid-year months.
Platinum price seasonality – comparative insights
Performance Shifts in Key Months
- January and February divergence in 2024: The significant divergence in January and February 2024, with a steep dip, suggests a departure from the long-term trend of early-year strength. This anomaly may signal caution for investors looking for bullish trends in early 2025.
- Consistent strong months – March/April and December: The strong months across the 2020-2024 and 2005-2024 periods, particularly March/April and December, align with the long-term trends, highlighting their reliability for positive returns.
Mid-Year Weakness Consistency
- Weak performance in June and July across periods: All periods, from the 50-year to the 2005-2024 and 2020-2024 data, show a consistent weakness in June and July. This suggests seasonal factors like reduced demand or market corrections affect platinum during these months.
Strong Late-Year Performance in 2024
- Late 2024 consistency with long-term trends: While early 2024 diverged from historical patterns, platinum’s performance from mid-year onward was consistent with the 50-year average. This suggests that the market may stabilize and follow traditional trends later in the year, even when there are anomalies earlier.
Platinum and silver price seasonality compared
In this section, we compare the insights we derived from our silver price seasonality with the ones in this article related to platinum price seasonality.
Early and late-year strength: Both platinum and silver show strong seasonality early (January to March for platinum, January to February for silver) and late in the year (September to December). These similarities suggest both metals may be influenced by common seasonal demand factors.
Mid-year weakness: Both metals exhibit weakness mid-year (June to July for platinum, June for silver), indicating a consistent seasonal pattern.
Divergence in recent years: Platinum’s early-year weakness in 2024 contrasts with silver, which did not show a sharp divergence. This could imply that platinum is currently more sensitive to specific market conditions or economic factors compared to silver.
Conclusion
There are 3 conclusions that we take away from the platinum seasonality charts:
- Emerging trends: The early 2024 divergence highlights the need for caution, as platinum might not follow traditional seasonality trends. Current market conditions, such as economic factors, supply chain disruptions, and investor sentiment, heavily influence its performance.
- Consistency in strong months: March/April and December show consistent strength across different periods, providing reliable opportunities for gains. However, caution is advised during mid-year months like June and July.
- Comparative insights with silver: While both metals share common seasonality traits, platinum’s sensitivity to recent market dynamics suggests that platinum investors might need to wait for silver’s outperformance before getting too excited about platinum’s prospects.
By understanding these seasonality conclusions, platinum investors can better handle the platinum market.


