As per our silver stocks forecast 2019 we have a bullish bias for the precious metals stock segment at InvestingHaven, with a preference for silver stocks. But how is this sector evolving with current volatility in the stock market? As per the precious metals long term stock chart we see a screaming buy opportunity in precious metals, especially silver stocks, at this point in time!
Note, we have not noticed any fundamental change against our gold forecast 2019 nor silver forecast 2019 which is why this article is focused on chart analysis. In other words through the charts we want to find out whether our forecasts are still intact or if the market is proving us wrong.
First, we start with a relative strenght view, one we also used in our silver stocks forecast article published several months ago: the silver stocks index compared to the S&P 500.
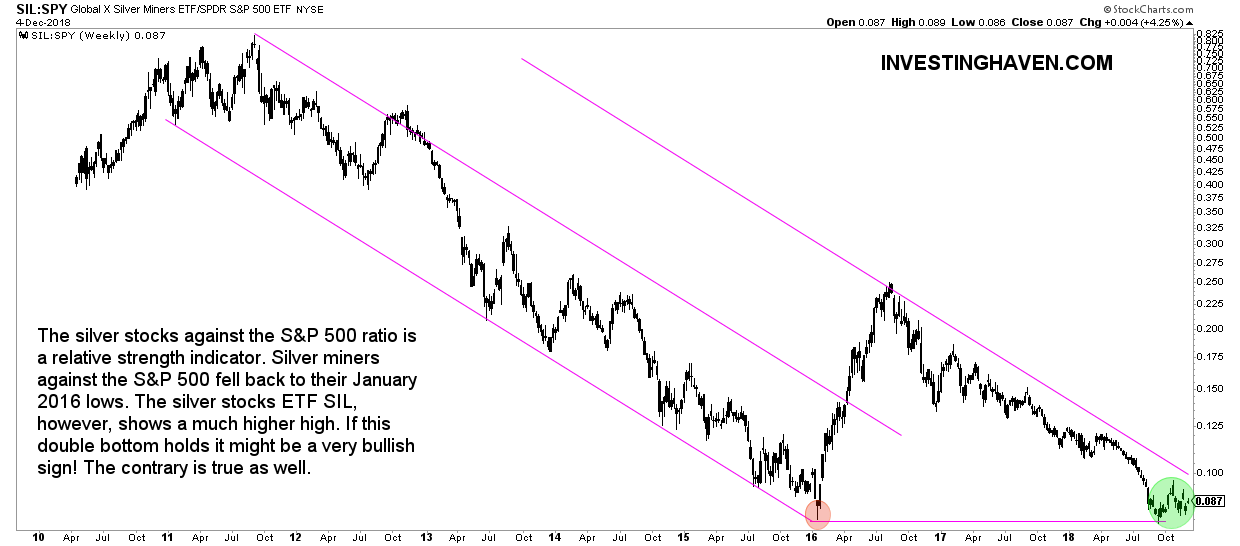
The silver stocks to S&P 500 ratio seen on the first chart below shows a great relative strength picture for the silver stocks sector. What really stands out is the test of the January 2016 lows. The recent decline bottomed exactly at the same level as the bottom 2.5 years ago.
This ratio is not going to determine any price level which is useful for our silver stocks forecast for 2019. However, it is helpful in understand how relative weakness has gone so far that it provides additional evidence that the bottom might be in.
What we see in recent months is a series of higher lows being formed right above long term support. That’s why we have annotated it with the green circle.
This is a bullish setup for the medium to long term. Note as well that this ratio is close its long term apex where the falling line meets horizontal support. This suggests it might be breakout time as the silver stocks sector is really at an oversold level.
As said before for fundamental analysis on the silver stocks sector we refer to this great piece silver stocks fundamentals article.
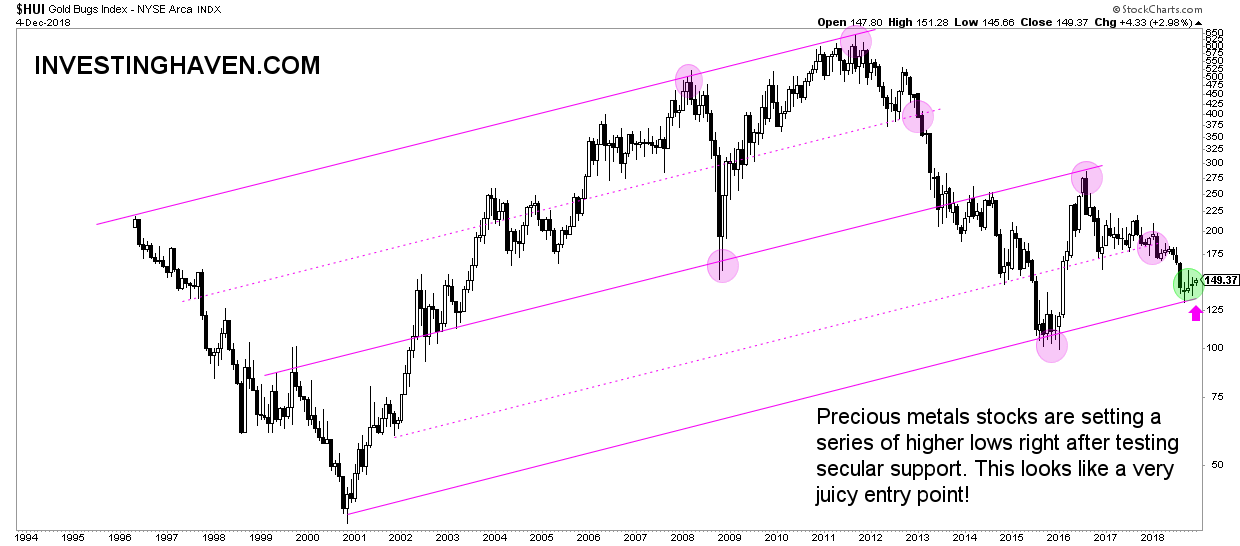
But from a chart perspective, especially the precious metals stocks sector and its long term trends we see an extremely interesting setup right now. Below is the HUI gold bugs index chart representing the precious metals stock sector. Note how secular support is tested for the 3d time on its 2-decade long chart. Note also how there is a series of higher lows in recent months.
This is an extremely bullish setup, make no mistake!
We believe, because of all this, that silver stocks will be the outperformers in the months and maybe years to come. We expect silver stocks to do very well as long as the $14 level in spot silver is respected. That’s why we consider this sector to be a screaming buy right now!


