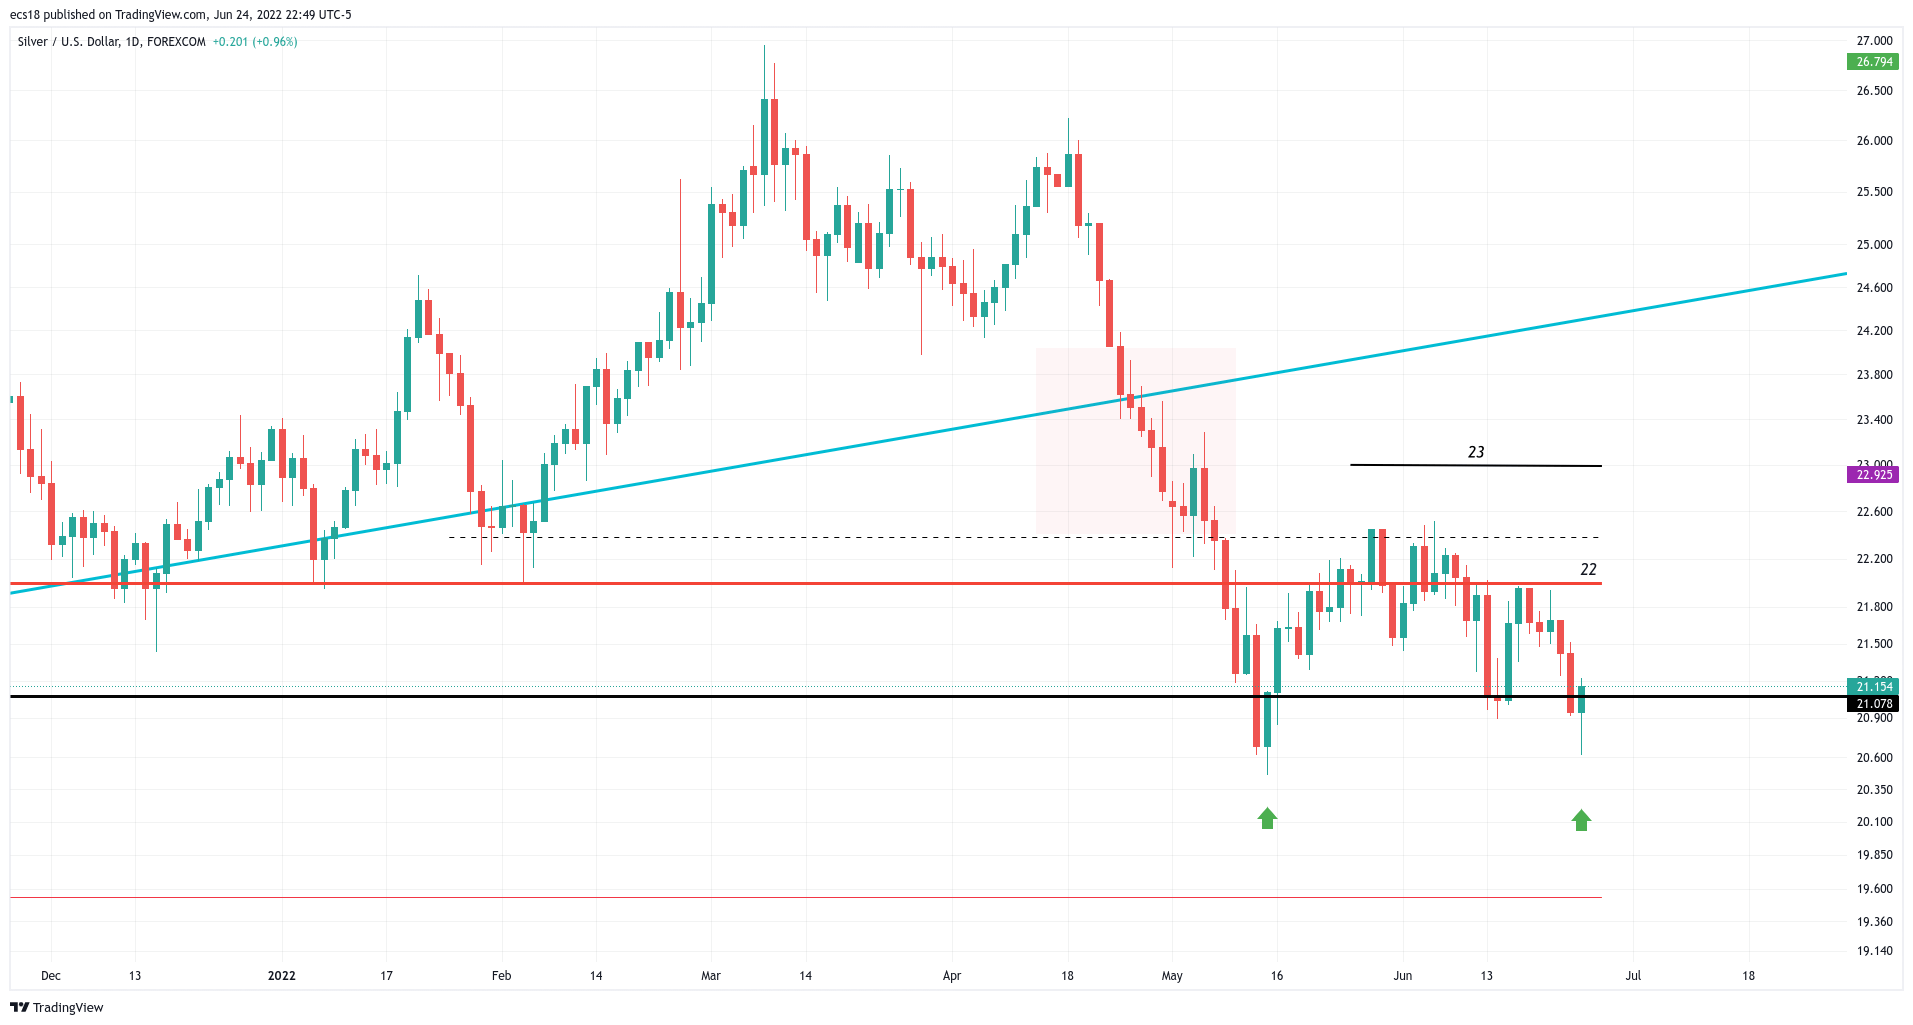
Silver is in the process of setting a double bottom. We are not concerned that silver will break down, for several reasons. The silver price chart shows this double bottom scenario and gives up precise numbers to work with for a trade but also for a long term oriented investment which would be in line with our silver forecast.
This silver chart setup might look scary. Many believe that silver will break down. We don’t! This is why.
First of all, silver rejected to move lower. You can see a really large ‘wick’ on Friday June 24th which suggests that lot of buying kicked in right above the lows of May.
Admittedly, the 22 to 23 area was not cleared but that’s exactly the point about this double bottom scenario: if resistance is too strong the market goes test support. Whatever happens near support is telling. The case for a double bottom is, at present day, strong and compelling.
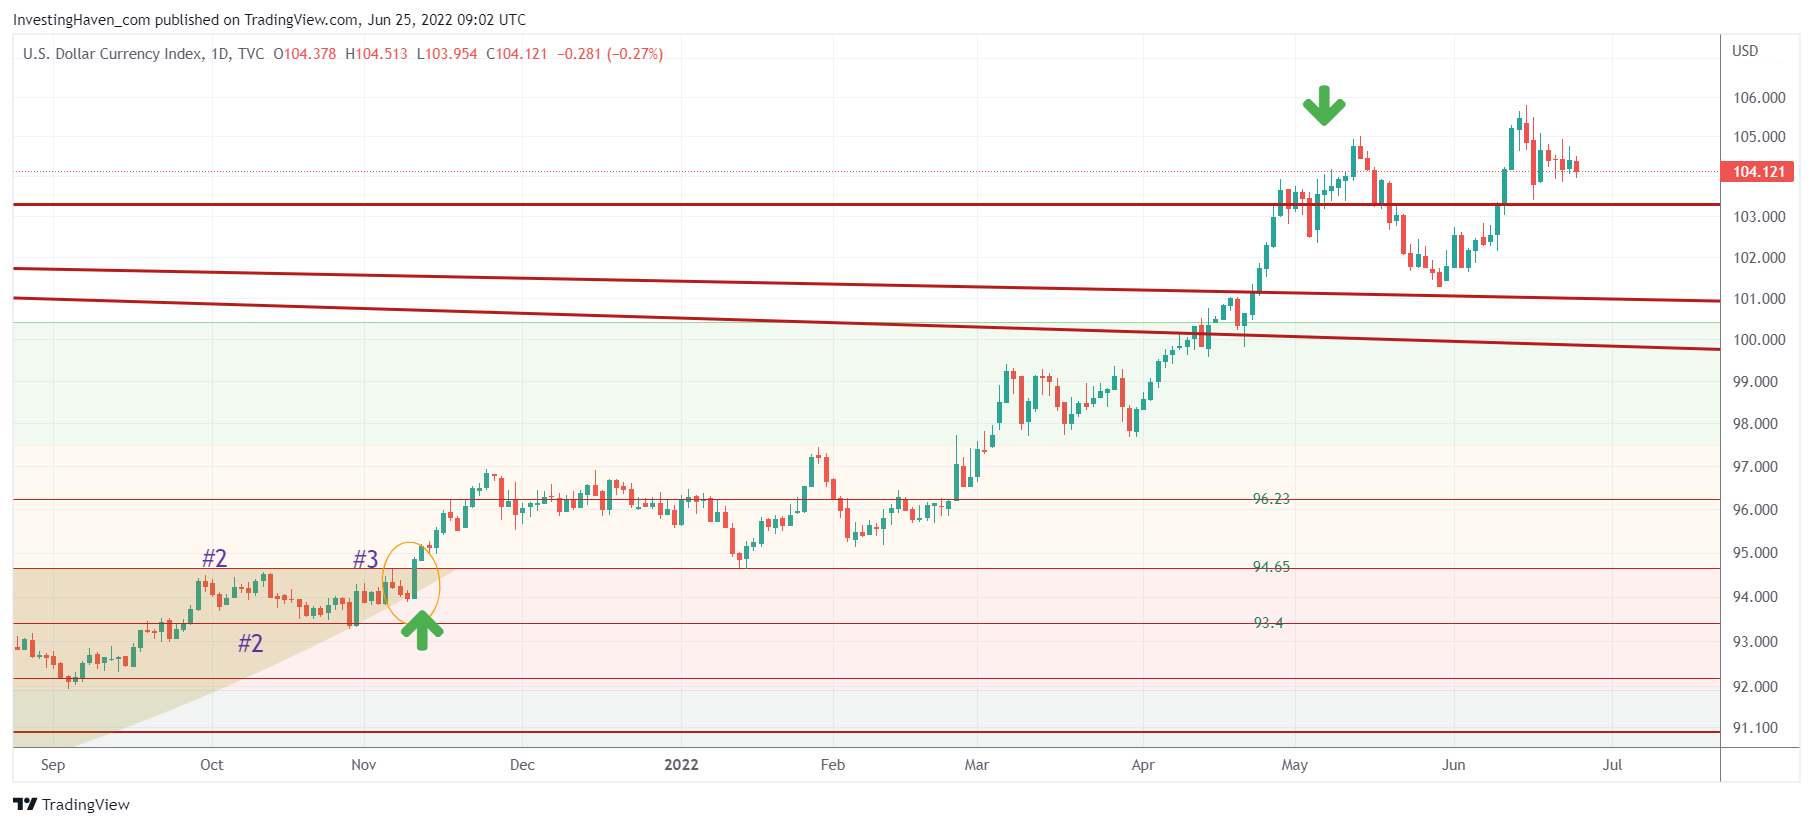
One of the leading indicators for silver is the US Dollar. As seen on the daily chart, there is hesitation in the USD. The 104-105 area is acting as strong resistance (everyone can see this). However, the more important thing is how vulnerable the USD is right now. A tiny move lower will confirm a double top that also everyone can see.
Because long USD was a very crowded trade it can quickly become the exact opposite.
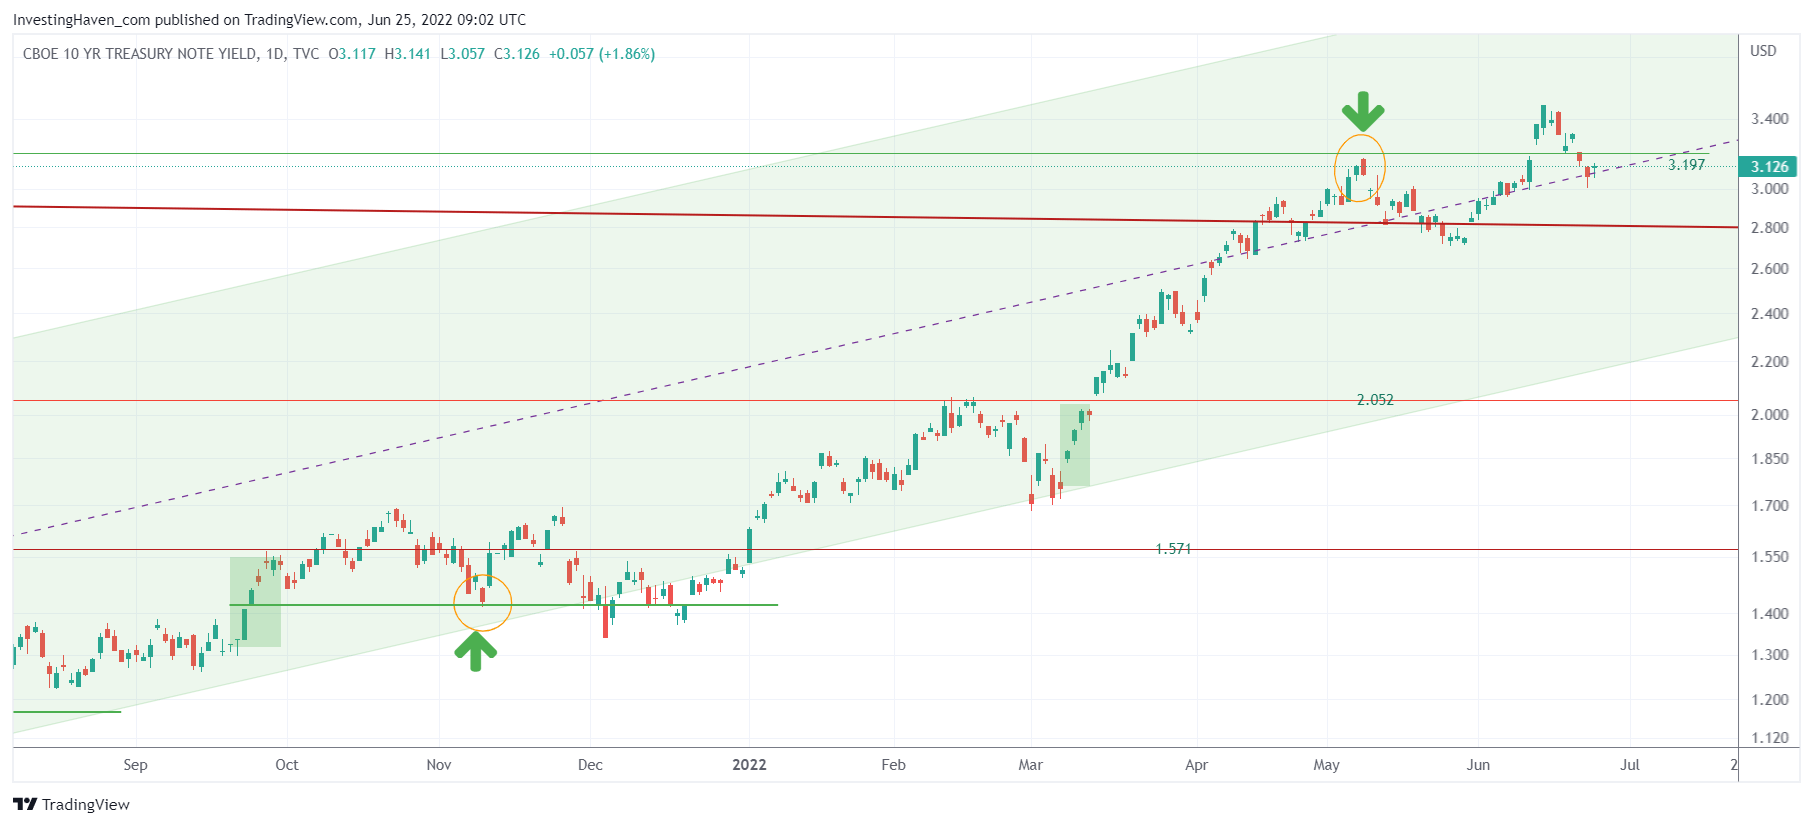
Another leading indicator is bond yields, also an inverse correlation with the silver price.
Bond yields seem to have confirmed a double top pattern. The inability to stay above the 3.197 price point is telling. We expect the USD to follow the path of bond yields, which is lower, opening the door for a double bottom confirmation in silver.


