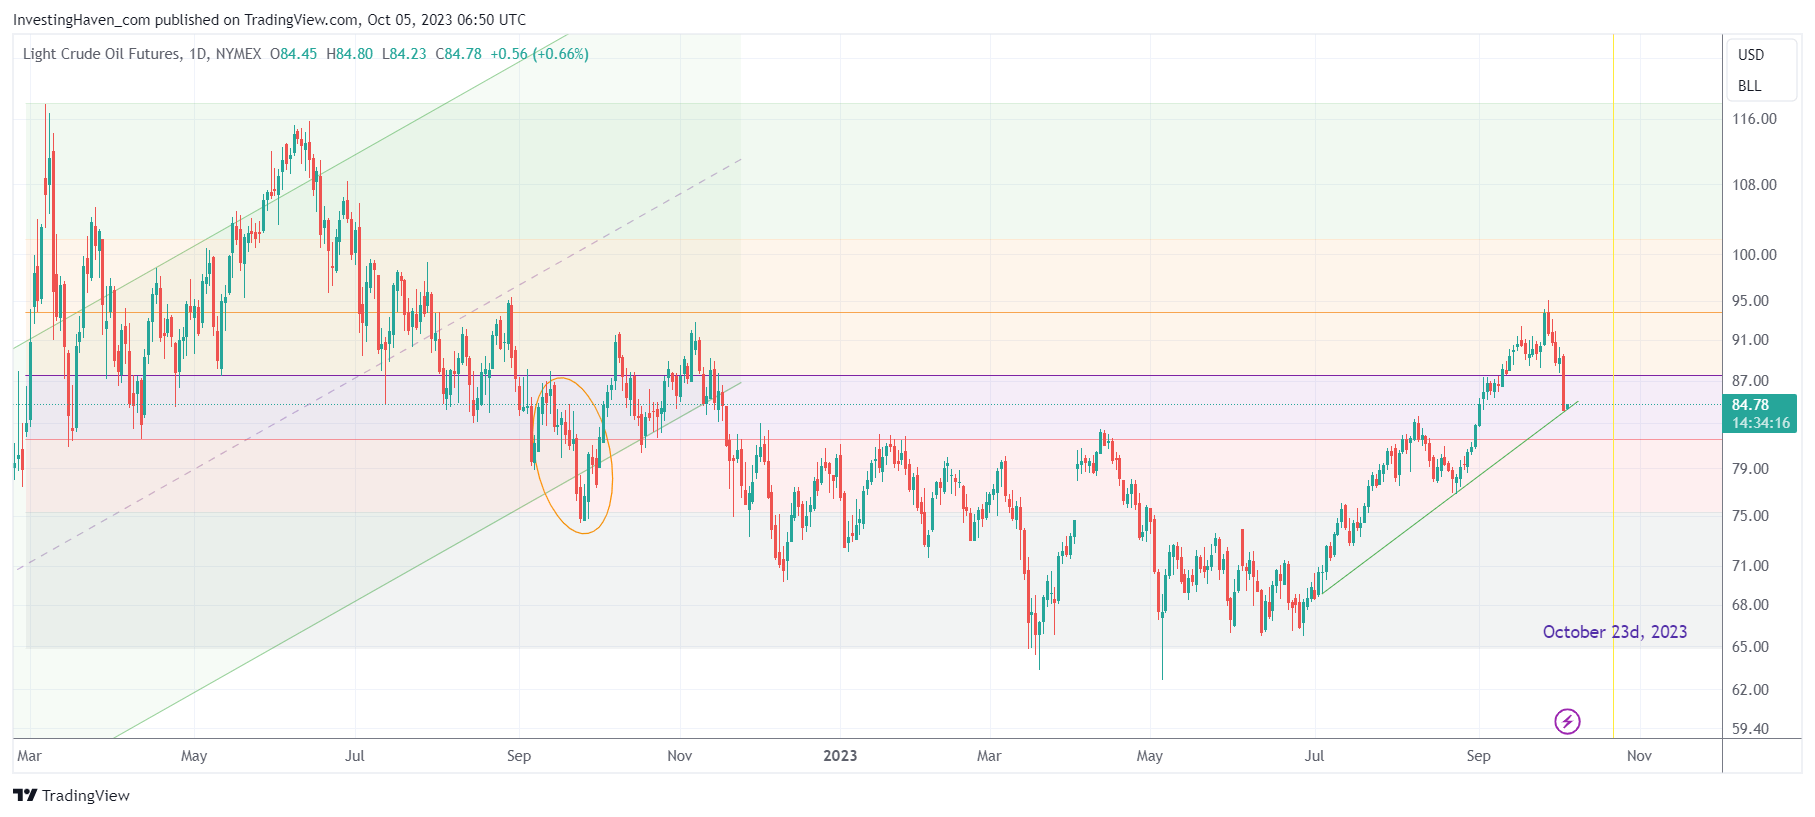
Crude oil’s recent surge has sparked inflation fears and impacted markets. A noteworthy intermarket trend has emerged: rising oil prices propelling treasuries and the USD. If crude stalls in October, it could trigger a broader market shift. Our analysis suggests this is likely to happen. While some believe that crude continues to be bullish, we believe otherwise. Crude does not qualify as a commodity investing opportunity in our view, a good time to buy was 3 months ago, certainly not in the near future.
We examine price and time factors: resistance at the 38.2% retracement level and a 3-month uptrend ending at the quarter. This piece educates on chart reading and trends, offering reassurance to concerned stock investors as evidenced by the ‘extreme fear’ readings in this Fear & Greed indicator.
While some continue to believe that crude remains bullish, our analysis is neutral, certainly not bullish crude oil.
Intermarket effects of rising crude oil prices
Crude oil’s recent price rally has caused ripples throughout markets, introducing inflationary pressures and reigniting concerns about potential interest rate hikes by the Federal Reserve. This upsurge has set off a significant intermarket relationship that’s unfolded in recent weeks: the ascent of crude oil prices has propelled treasuries higher, resulting in an upswing in the value of the USD.
Now, if crude oil prices were to hit a plateau in October, it might just herald a pivotal shift in market dynamics. This transformation wouldn’t be confined to energy stocks; it could extend its influence to the broader financial markets. This article aims to provide insight into why our analysis indicates that crude oil’s ascent may indeed pause in October 2023.
Our analysis centers around two critical dimensions: price and time.
Price-wise, we observe that crude oil’s ascent faced staunch resistance as it approached the 38.2% retracement level. Intriguingly, this same level had previously marked the termination point of crude oil’s uptrend in August 2022. This observation highlights a historical correlation between this retracement level and the conclusion of crude oil’s bullish phases.
Now, let’s delve into the time aspect of our analysis. The surge in crude oil prices commenced around July 1st, and a notable rejection candle materialized right at the 38.2% retracement level on September 28th and 29th. This timeline analysis draws attention to the fact that this 3-month uptrend aligns precisely with a fiscal quarter. Such uptrends spanning three months often hold significance. Not only are they potent, but they also tend to adhere to precise timelines, frequently culminating at the close of the quarter if the commencement and culmination dates coincide accordingly.
In summary, our analysis focuses on crude oil’s price action and the influence of time on its trends. By understanding these facets, investors can better comprehend the dynamics at play in the crude oil market. Additionally, the potential scenario of crude oil’s ascent pausing in October should provide some relief to investors who have been closely monitoring its impact on broader financial markets.


