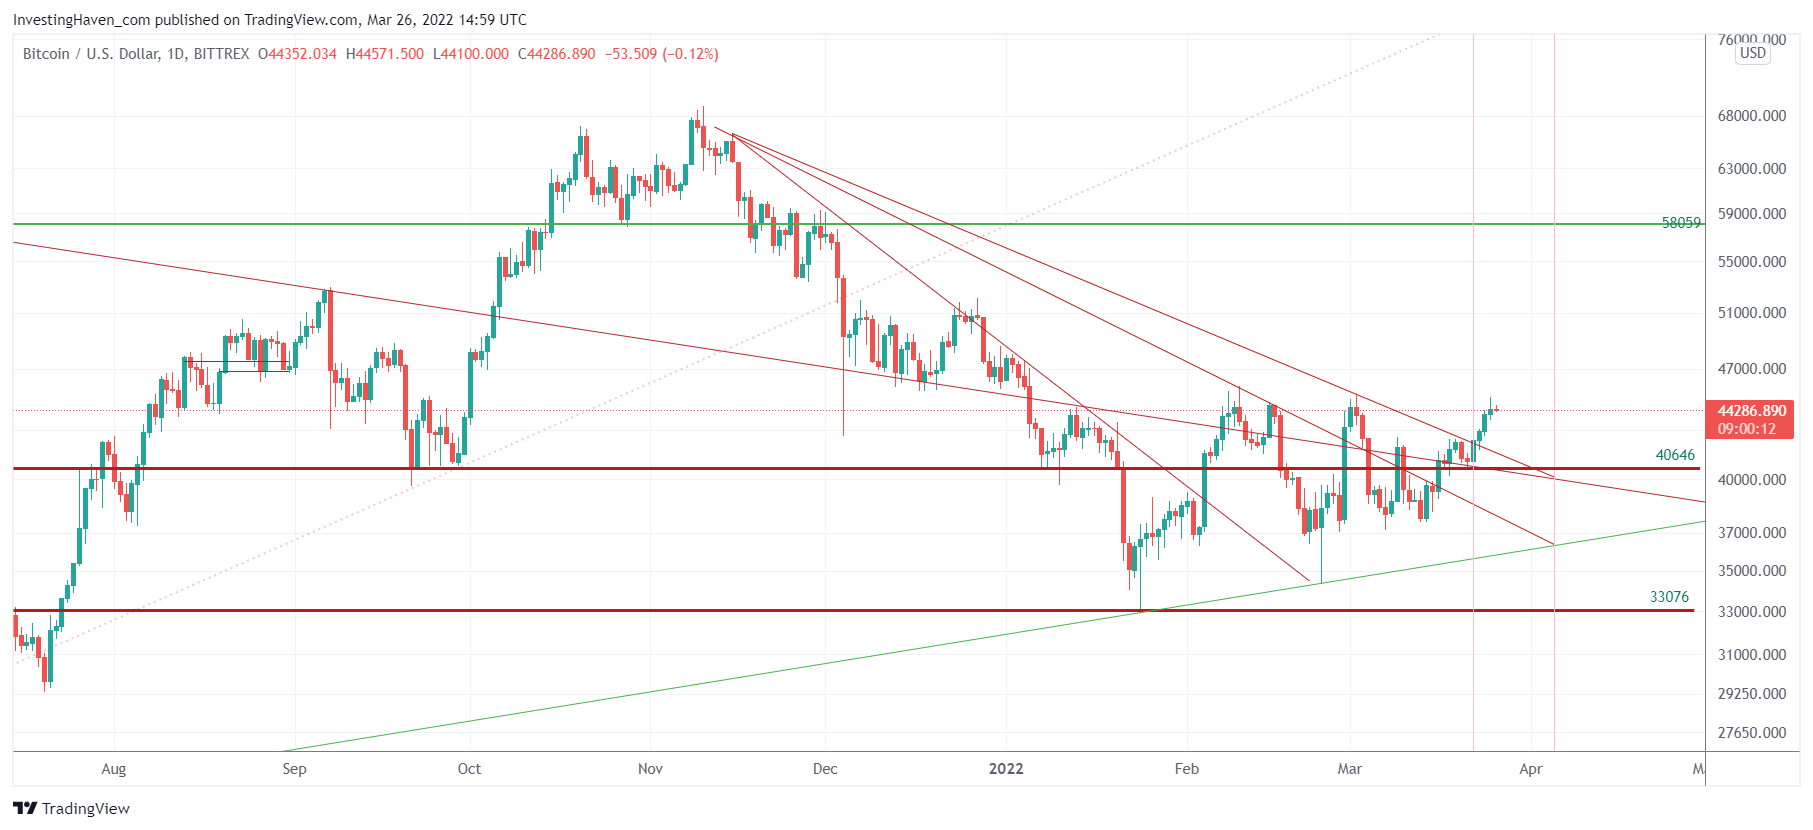
Bitcoin’s chart is a very complex one to understand. If you look at the setup embedded in this article you’ll understand why it’s not easy. No, we are not ‘just’ drawing some lines here to make it look complex nor to overload the chart. The point about Bitcoin is that it’s moving in what we call a ‘high tension’ area. Typically, it takes time to work through all resistance and support in such a ‘high tension’ area. While BTC remains our leading indicator we believe that the real opportunities in 2022 will present themselves only in specific crypto segments, like specific NFT segments. We called it the ‘unicorns’ in our Cryptocurrency Predictions 2022.
In today’s article we won’t talk about price predictions. In the end, that’s what the whole world is trying to do. We remind our followers that was the first in the world to publish crypto forecasts in the public domain, early 2017, most of those articles are still available on our blog.
Moreover, InvestingHaven was the first in the world to run a crypto investing research service.
When the entire world is focused on price predictions, we are one step ahead and we are focused on time predictions which are very helpful in better understanding price predictions.
We mentioned in our research service to premium members (several weeks ago) that March 22nd was a key date. And what happened that day is that BTC confirmed a ‘local break up’ which means it showed strength. This is a great confirmation because price and time are in synch!
Surprise surprise, in this article a week ago Bitcoin: Is This The Last Hurdle To Overcome we suggested that Bitcoin has to overcome one falling trendline:
What’s the hurdle to overcome? The 3d falling trendline. Most consolidations tend to clear 3 falling trendlines before a new bullish trend starts.
It happened on March 22nd.
The next key date to watch is April 5th. Whatever BTC is going to do on that day, in terms of price, will inform price direction and will increase our confidence in a price forecast.
There is a lot of structure on the chart, but you have to understand the chart and not just focus on price analysis. In the end, the chart has two axes, not just one. That’s what differentiates our work from our peers out there: we look at 2 axes, not one, we get all relevant information out of the chart.
We share crypto investing research insights in our premium crypto service >> To illustrate our work, we included in this article just one of the 6 distinct BTC charts that help us understand the trend and predict future moves. Our crypto alerts always start with BTC charts as BTC sets the direction for crypto markets (leading indicator).


