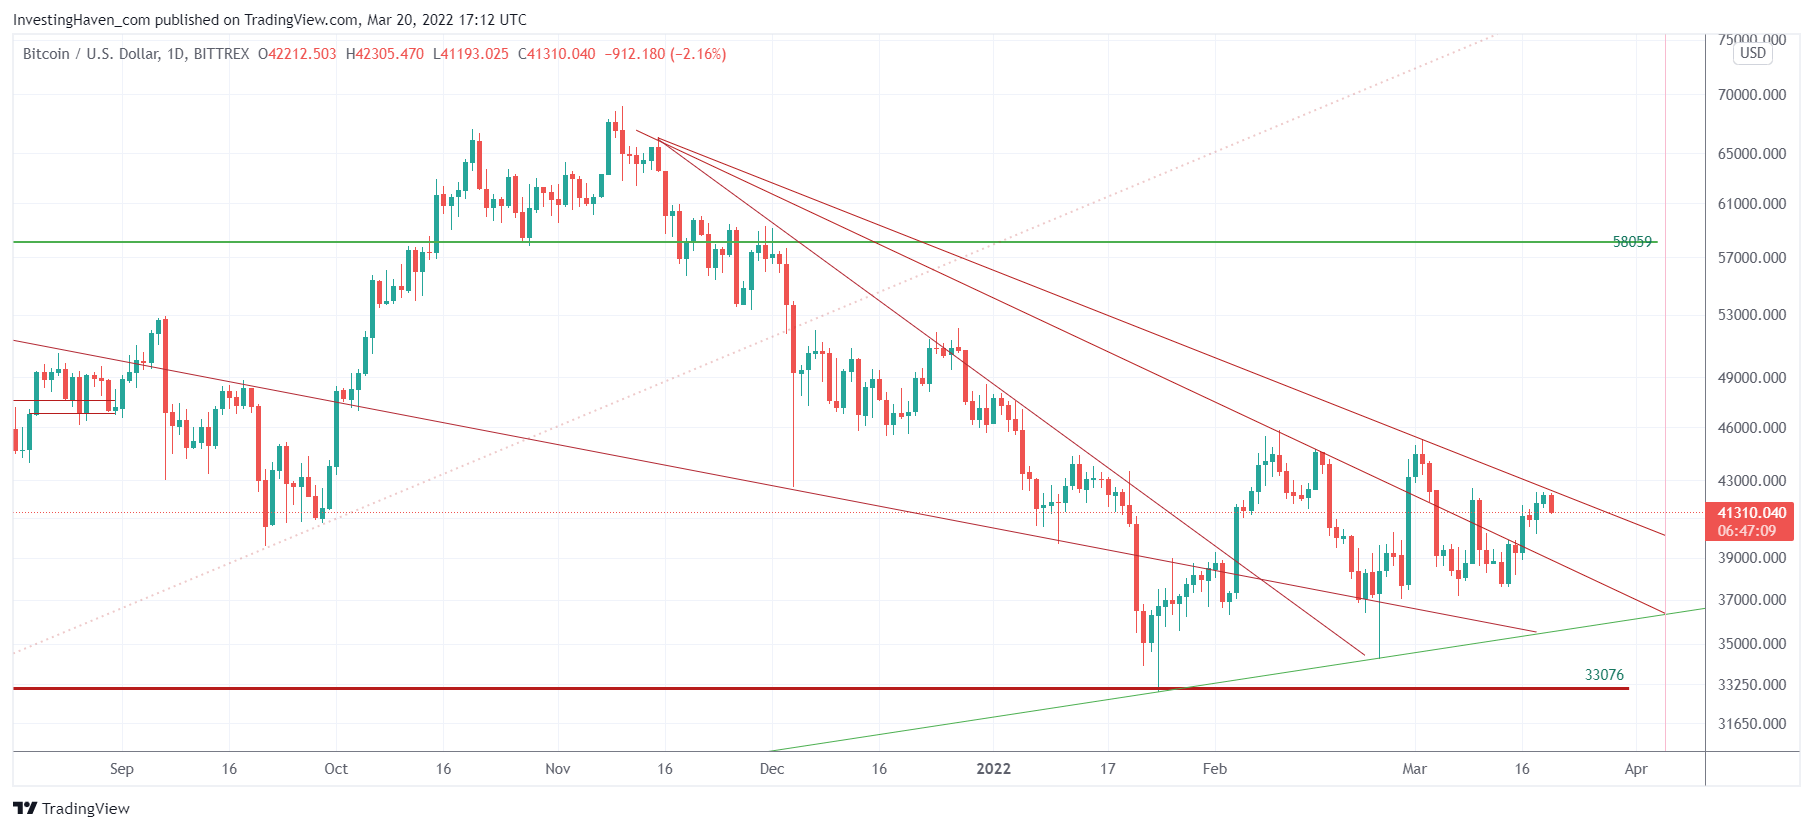
Bitcoin is trading in a wide consolidation. In essence, since the 2nd week of January, for more than two full months now, Bitcoin is stuck in a wide range. Crypto investors are waiting for the ‘3 magic weeks in crypto’, and they might start as soon as BTC is able to overcome this one last hurdle.
Consolidations can be frustrating.
Consolidations certainly shrug off bulls and bears.
Consolidations are volatile, almost ‘designed’ to frustrate investors so they leave the market.
Those are the conditions for a market to get quiet, and bulls to take over control.
The BTC chart has all that: wild swings in both directions, failed breakouts and failed breakdowns.
One thing is clear though: the structure on the BTC is getting narrow, and resolution is not far away. We believe it’s a matter of weeks until we see a new trend.
What’s the hurdle to overcome? The 3d falling trendline. Most consolidations tend to clear 3 falling trendlines before a new bullish trend starts.
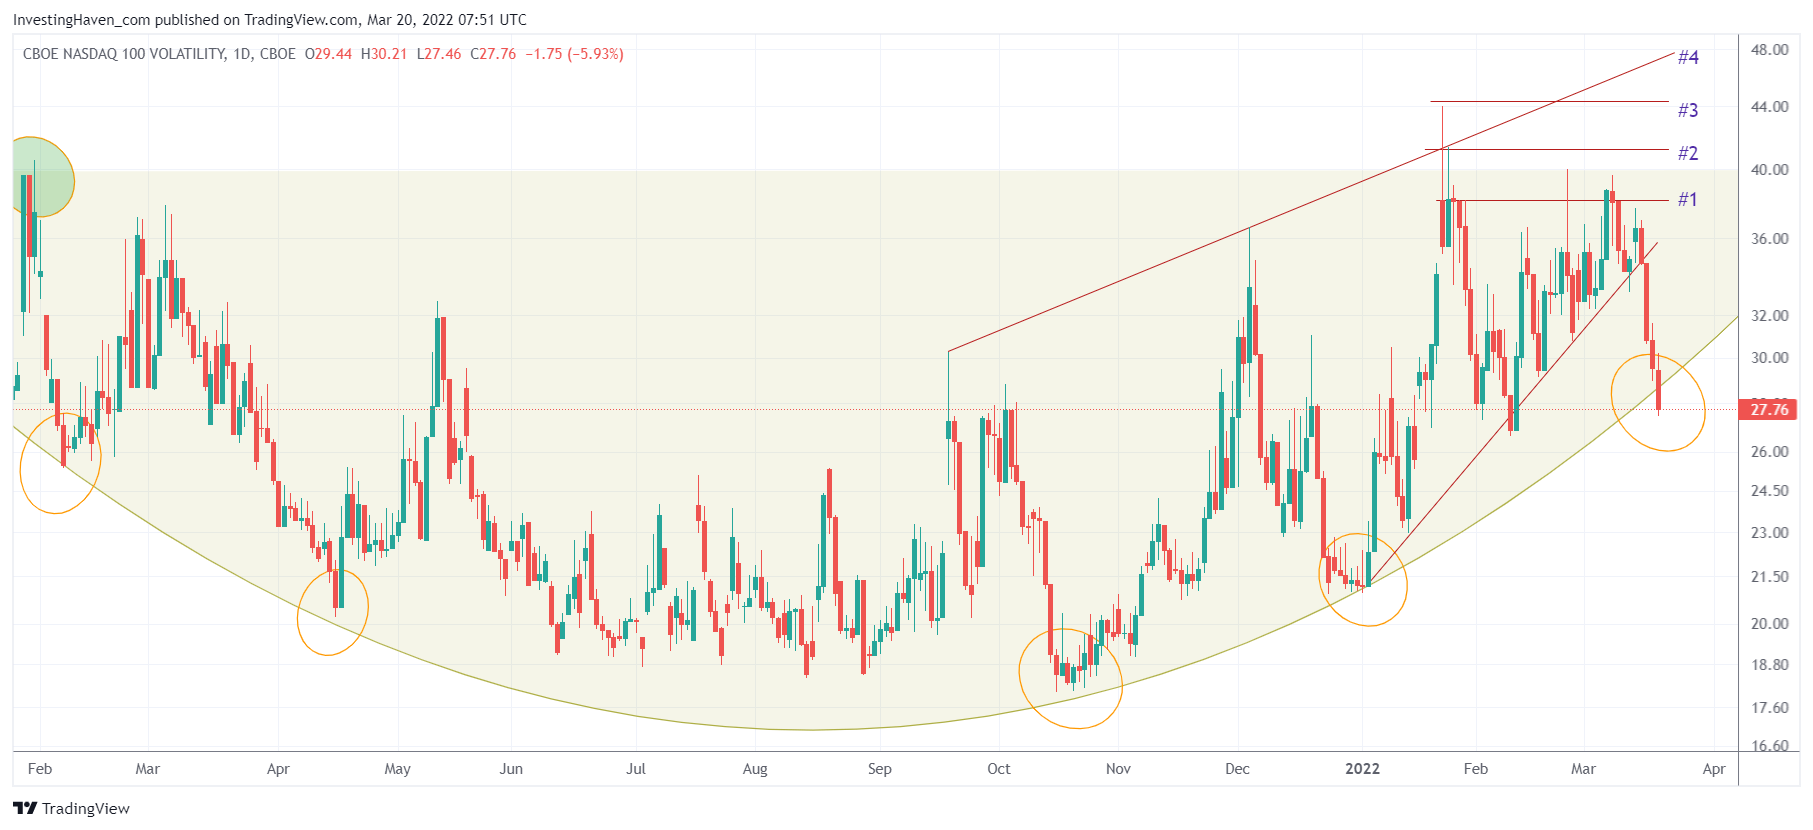
The one indicator that can support Bitcoin is the Nasdaq, particularly its volatility index. We covered this indicator in this article Technology Stocks: The Start Of A Crash Or Renaissance Underway?
If anything, the Nasdaq volatility index is struggling here. Two good days in markets and this index breaks down after a violent bear market that started on January 4th (see trendline).
Look how the Nasdaq volatility index failed to move higher in February/March, and how it got back down. It is even ‘trying’ to completely break down, which, if it happens, might be supportive of crypto. That’s because BTC and the Nasdaq are strongly correlated since last summer.
We share crypto investing research insights in our premium crypto service >> To illustrate our work, we included in this article just one of the 6 distinct BTC charts that help us understand the trend and predict future moves. Our crypto alerts always start with BTC charts as BTC sets the direction for crypto markets (leading indicator).


